What Is a Test Results Dashboard and When Do You Need One
What a test results dashboard actually does, how it differs from your CI logs and your test framework report, and the point at which a team starts needing one
Jul 17, 2026
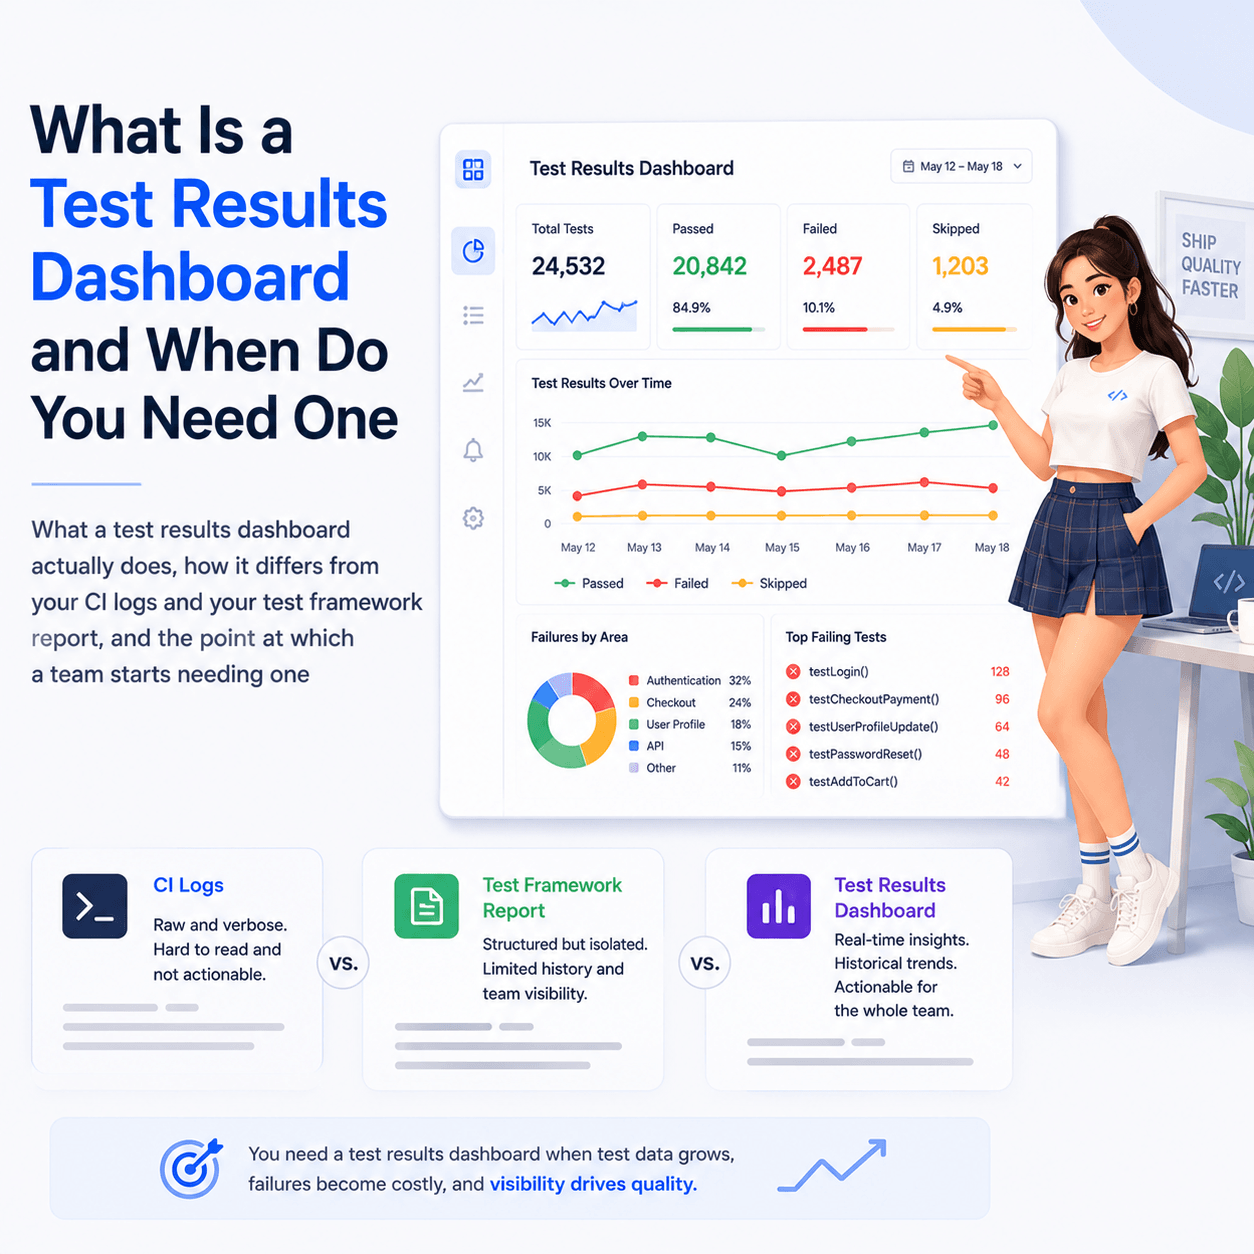
A test results dashboard is a view that collects test results from every test job you run, keeps them after the run ends, and shows the current state of each job in one place. That is the part your CI logs and your test framework report do not do. A framework report describes one run of one suite and is written fresh each time. CI logs are per job and roll off. A dashboard is the layer above both: results from all your jobs, retained across runs, so you can see pass rate direction per job and drill into any failing test. You need one when you have more than one test job, more than one person who cares about the results, or a reason to know what a test did last week.
What does a test results dashboard actually show?
The defining feature is scope. A test framework report covers one execution of one suite. A dashboard covers every test job in the project at once.
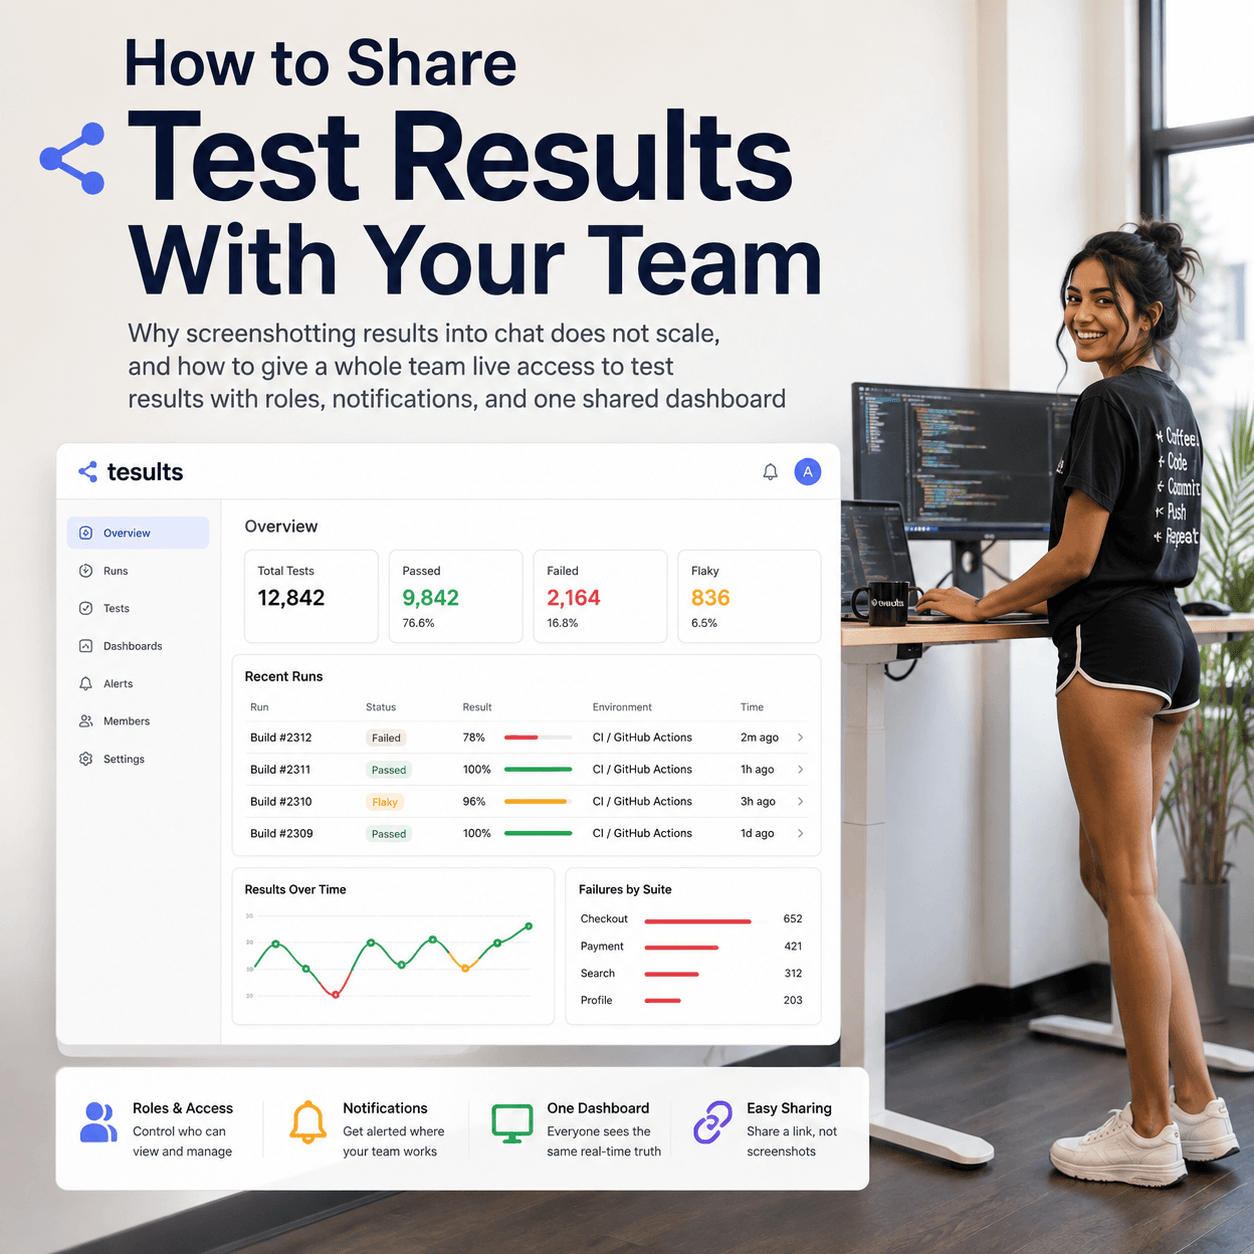
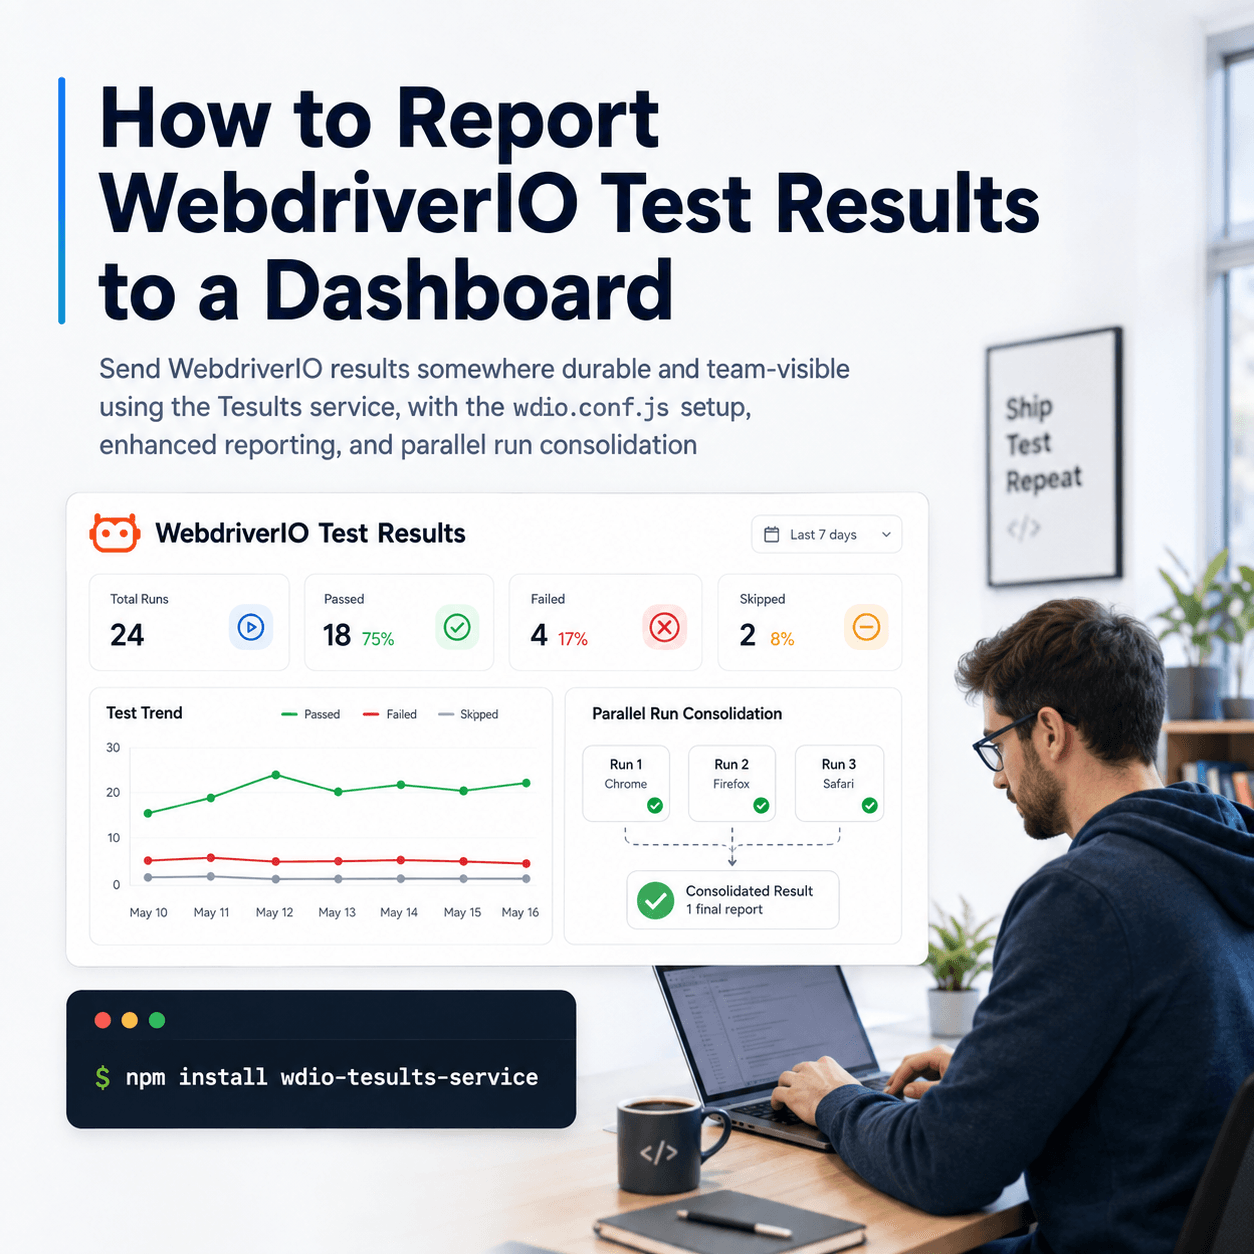
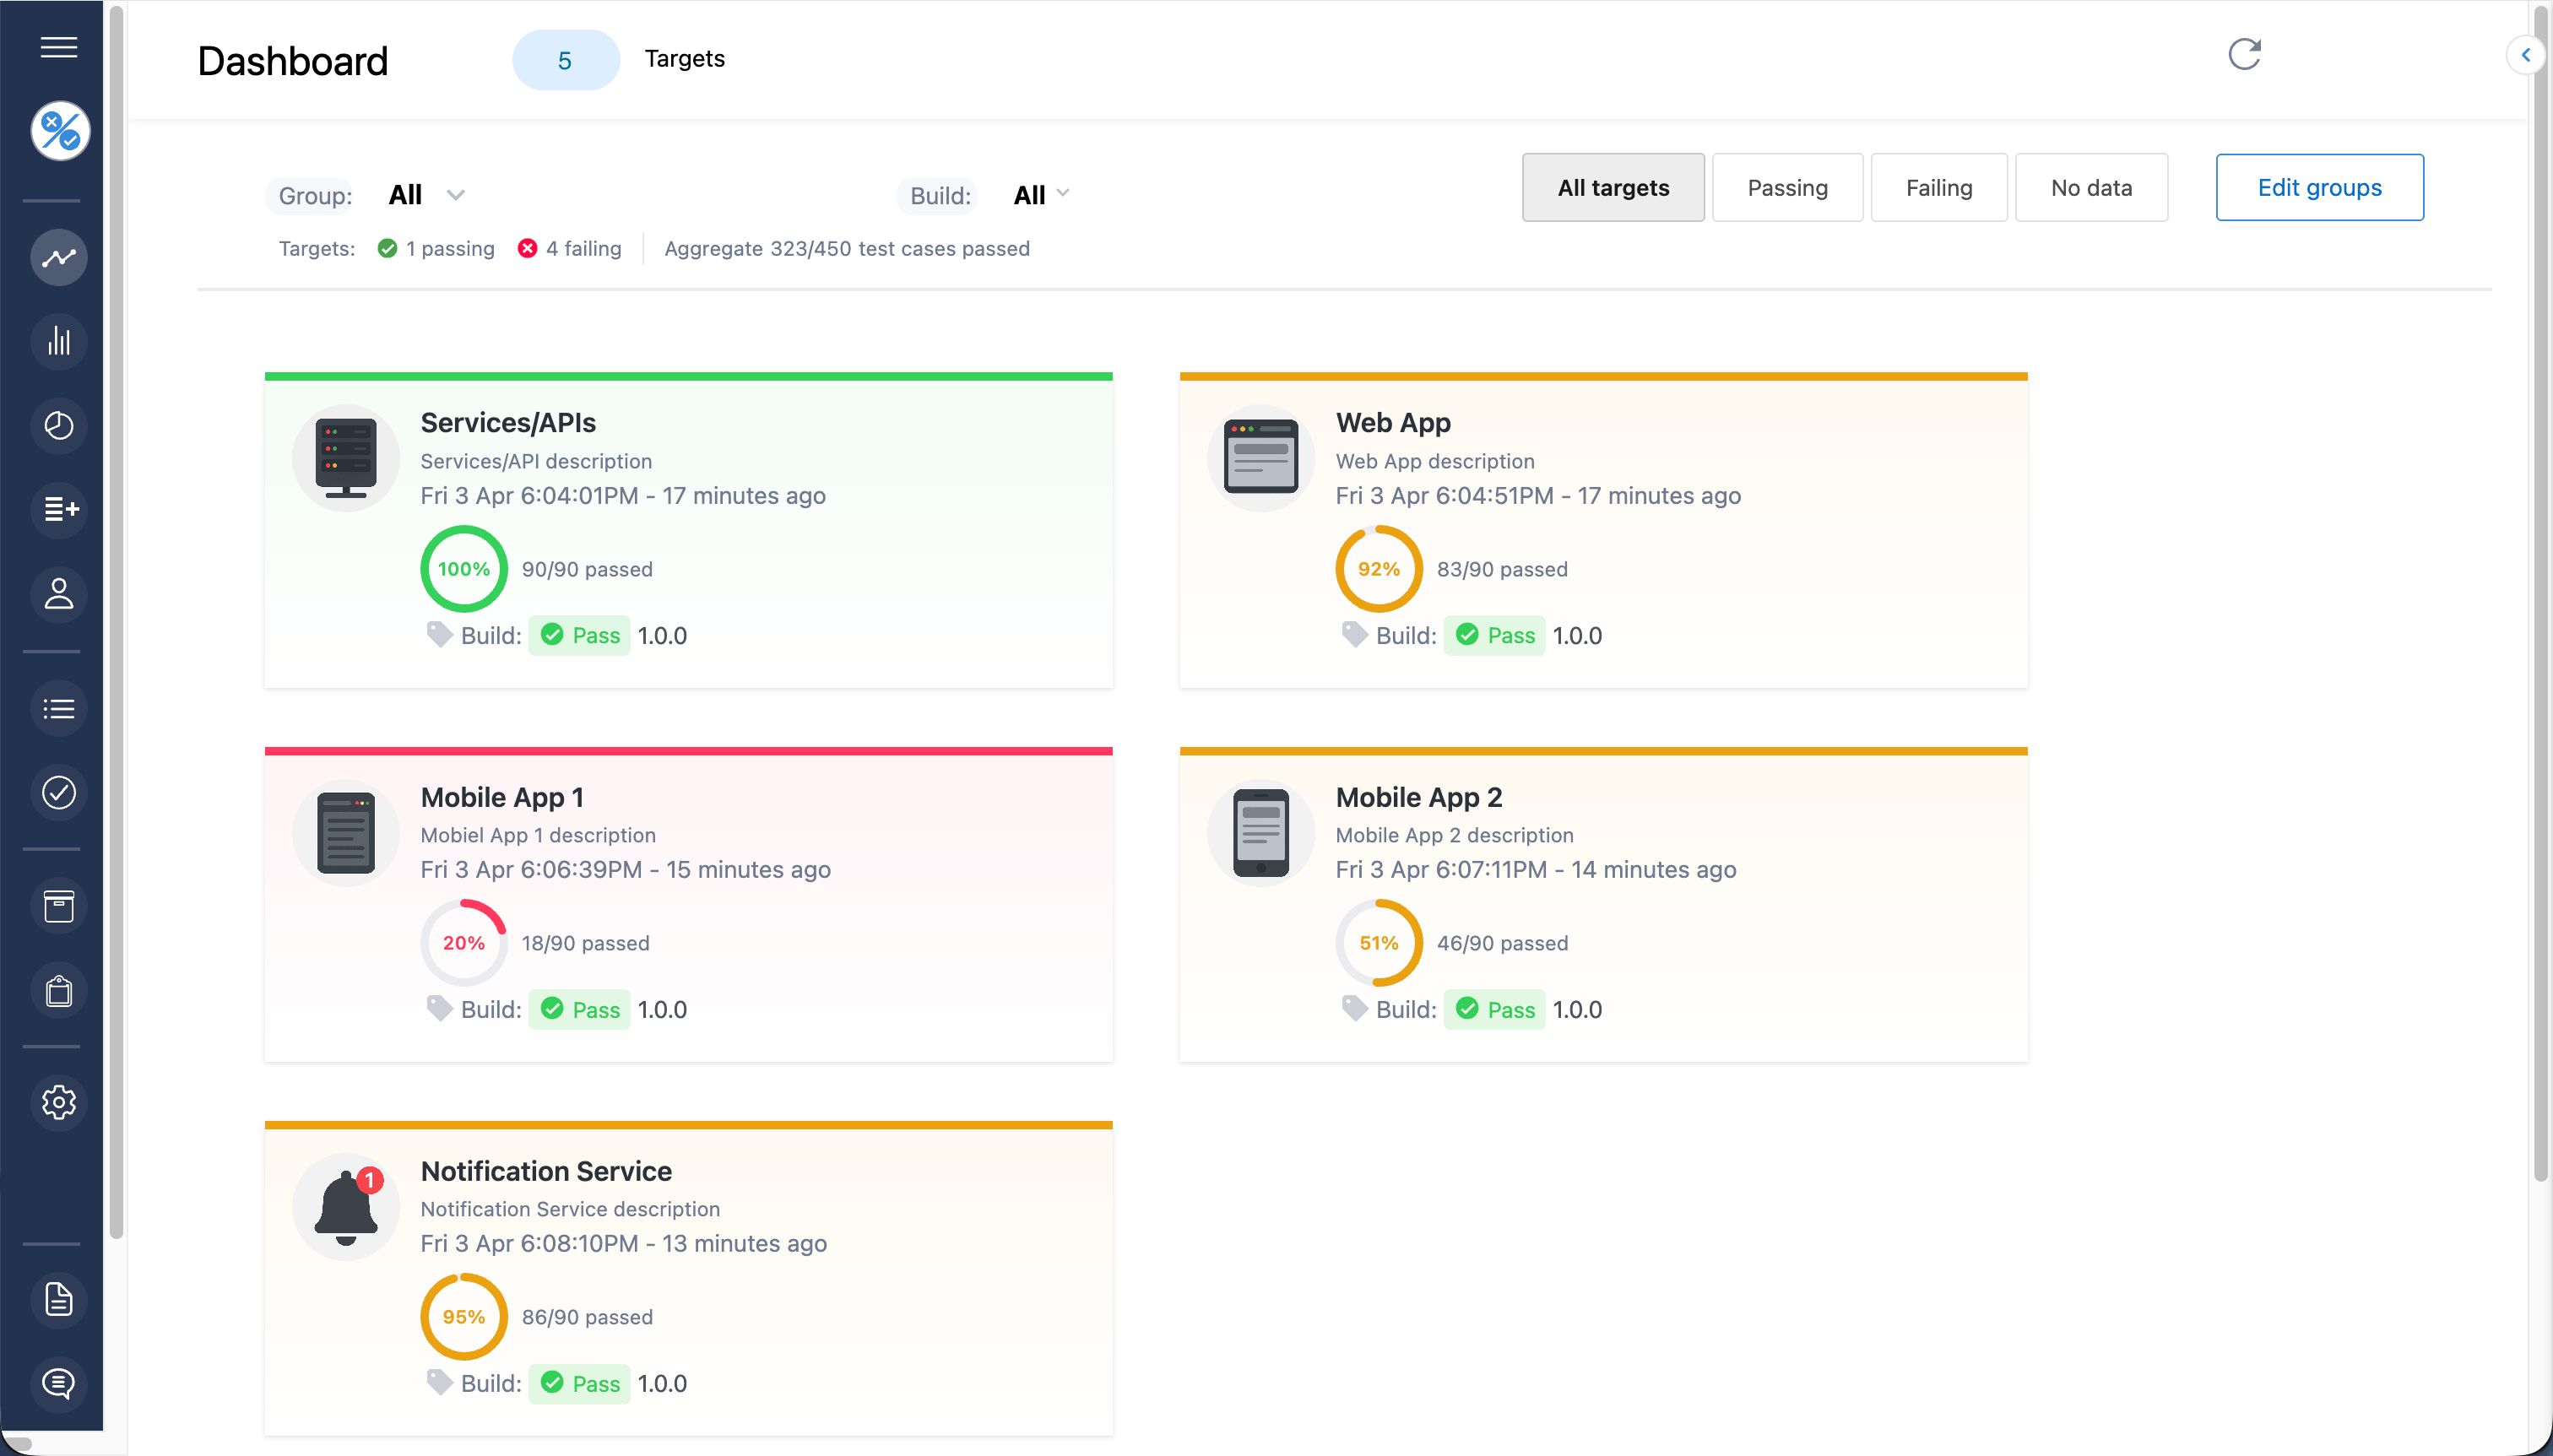
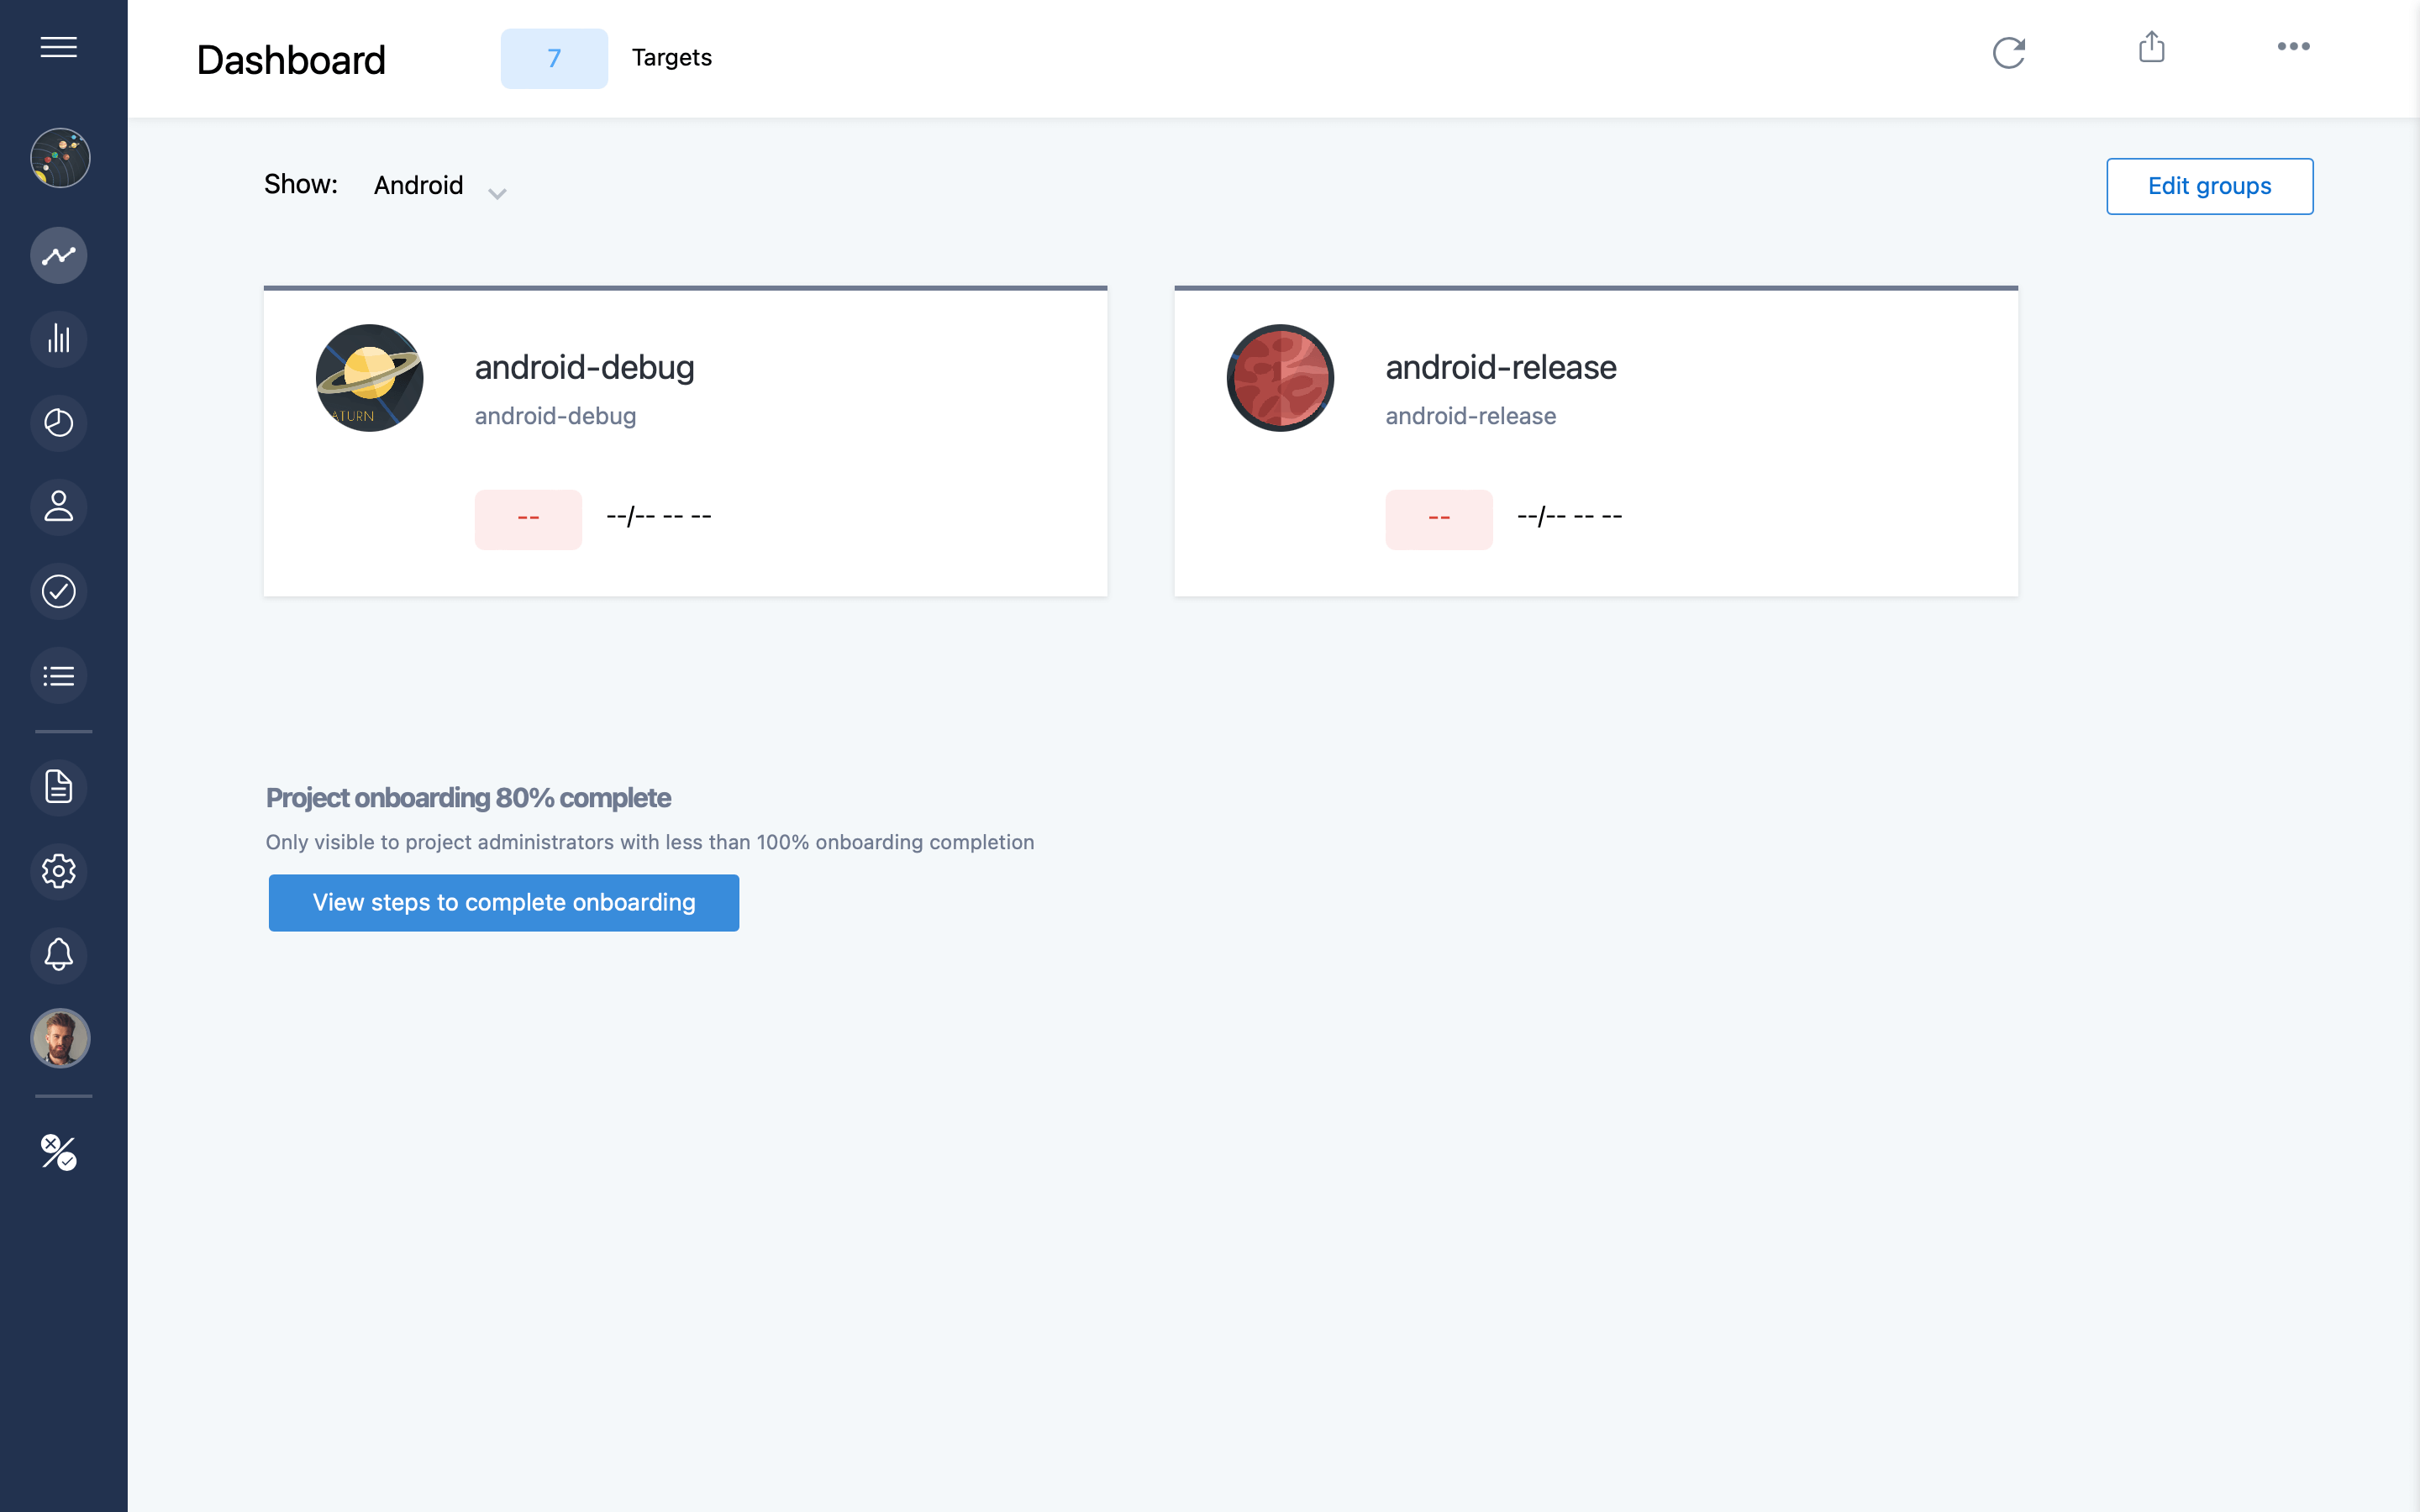
In Tesults the dashboard displays the latest results of all targets in a project, where a target is a test job. Each one shows whether its pass rate has improved or deteriorated, so the project level question, is anything worse than it was, gets answered by looking rather than by opening things.
From there you click a target to drill into the results view for that job, where suites are grouped so you can expand and collapse them to work through a run, and clicking a test case brings up its details, images and files attached to it, and the ability to assign a failing case to a team member or comment on it.
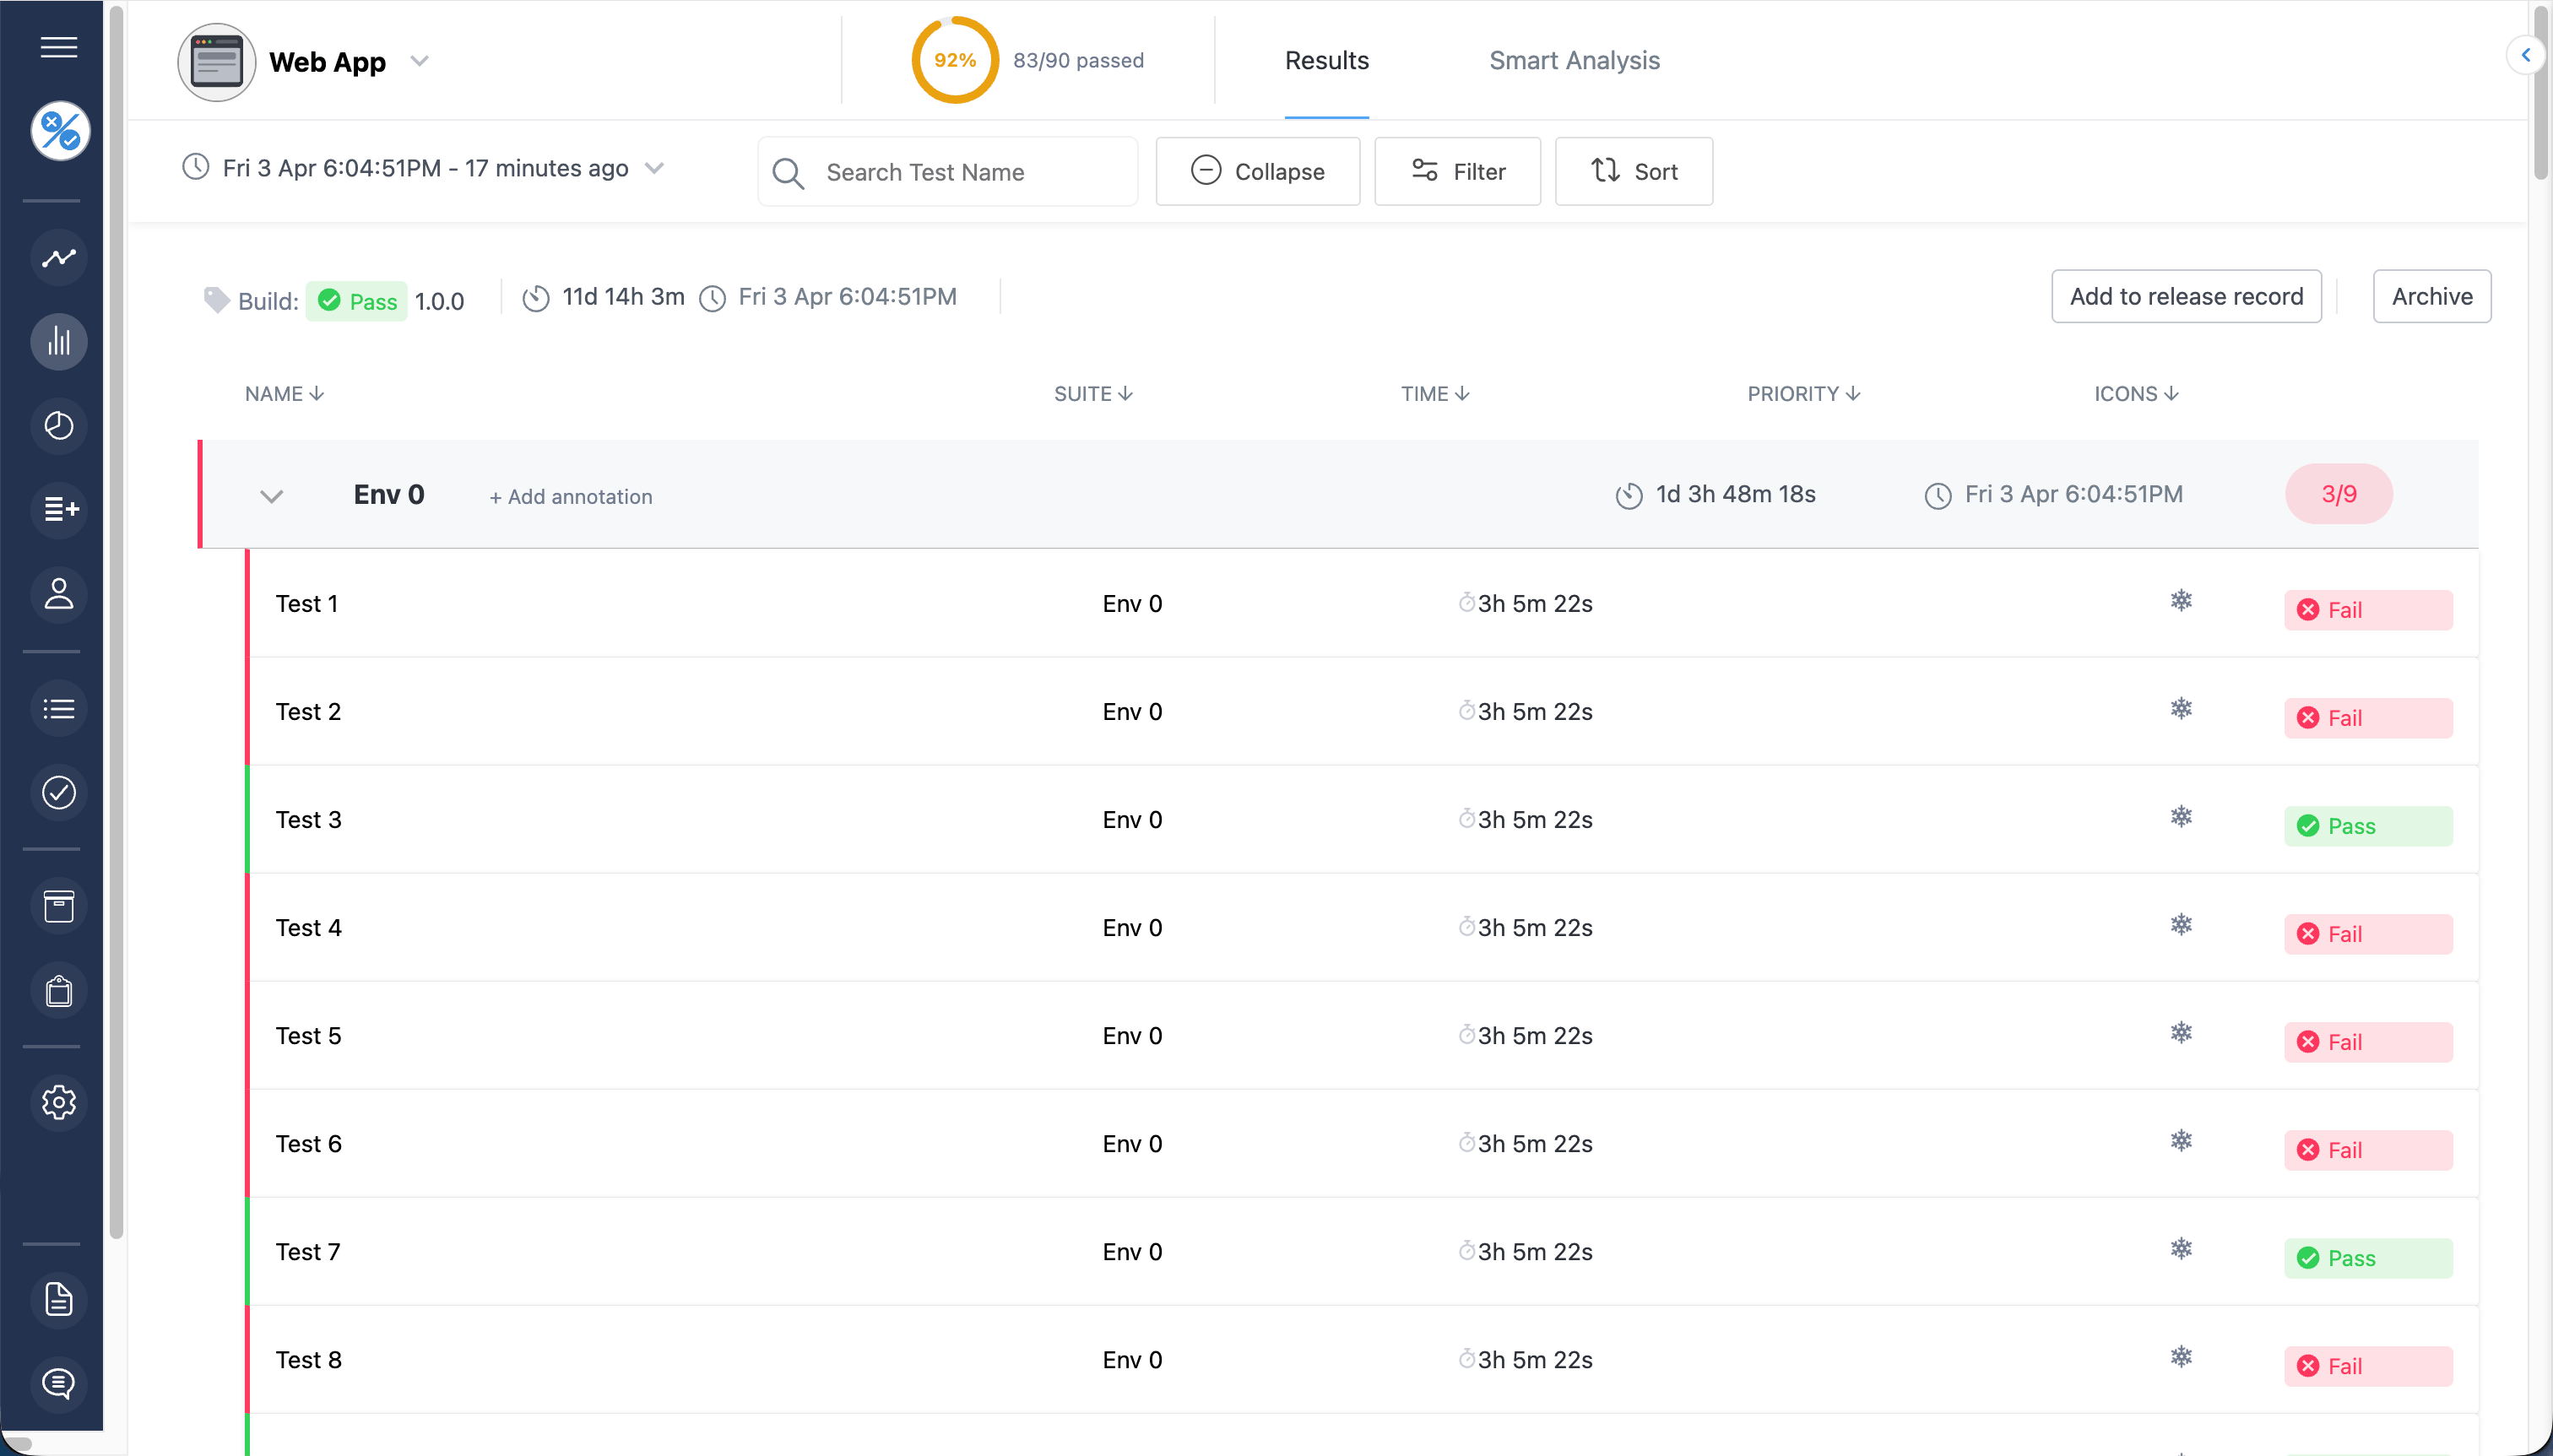
Those two levels are what a dashboard is for. Wide enough to see the state of everything, deep enough to land on a single failing assertion without leaving the tool.
How is it different from my CI logs or my framework report?
All three tell you about tests, so the distinction is worth being precise about.
Your framework report, the HTML output from pytest, Playwright, Jest and the rest, describes a single run in isolation. It is generated fresh each time and knows nothing about the run before it. It cannot tell you a test has been failing for a week, because from its point of view there was no last week.
Your CI logs are scoped to one job and are transient. They exist for a retention window and then go. Even inside that window they are plain text you scroll, not a structure you query, and they are separated per job, so seeing across your suites means opening several tabs and holding the comparison in your head.
A dashboard differs on both axes at once. It is cross job, so every suite reports into one view. And it is durable, so each run is retained and becomes a point of comparison rather than output you read once and lose. Everything a dashboard offers that a report cannot, trends, regression detection, knowing when a test started failing, follows from those two properties.
When do you actually need one?
Not every team does, and it is worth being straight about that. If you are one developer running one suite locally, the terminal output is the right tool, and a dashboard would be ceremony. The need appears when one of these becomes true:
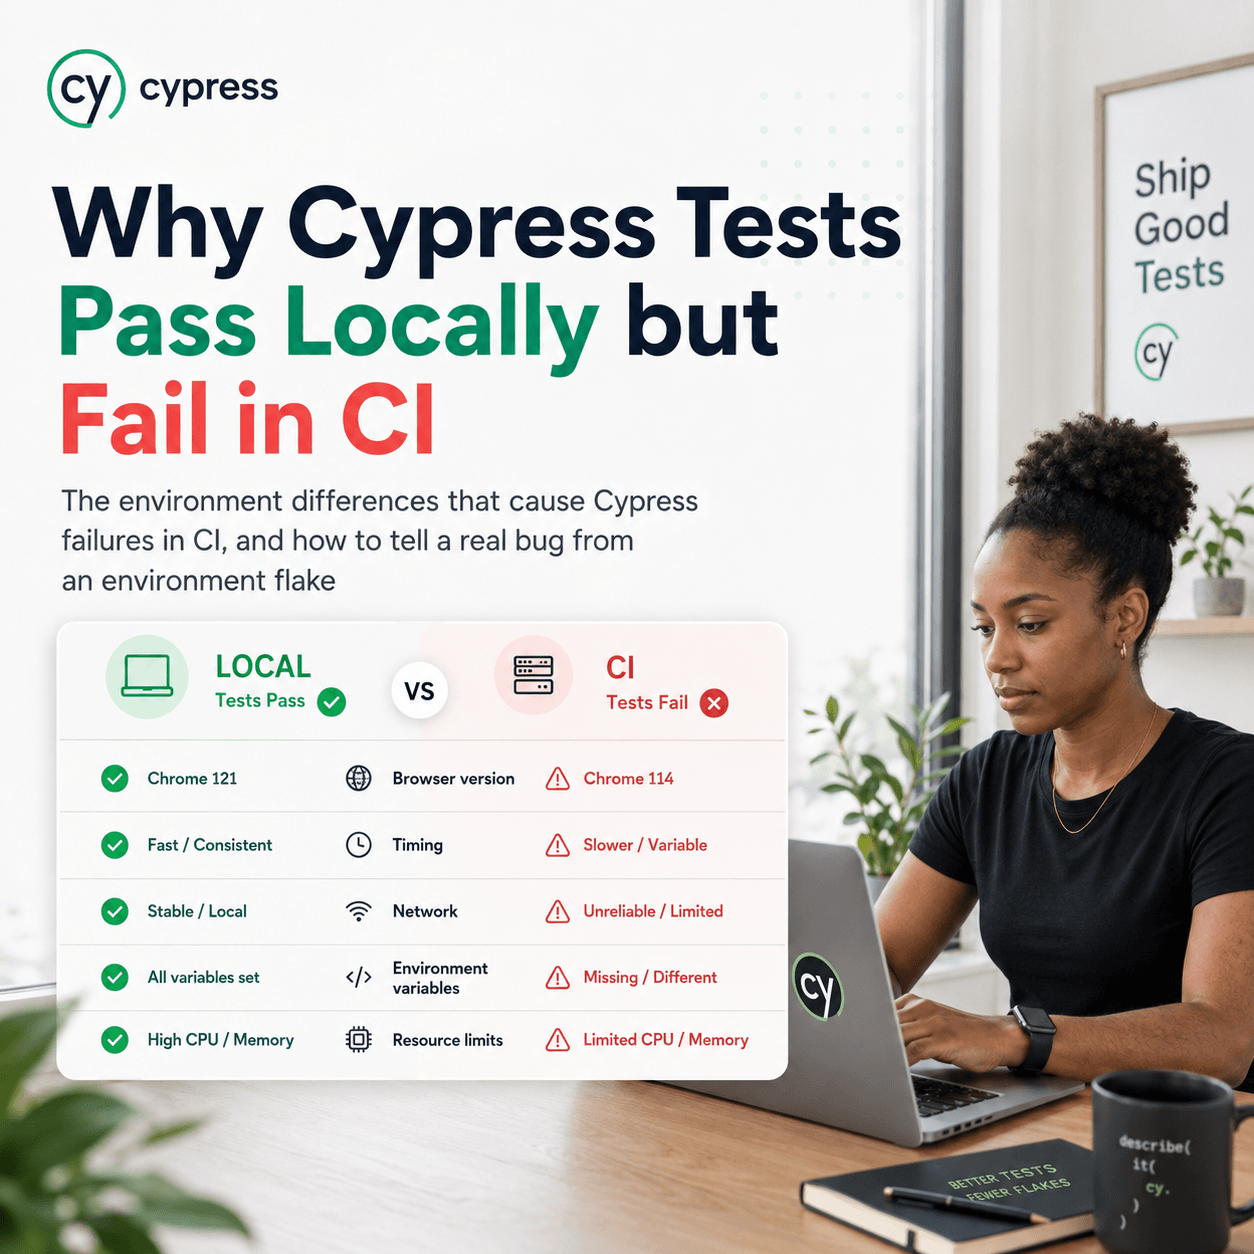
You have more than one test job. This is the most common trigger, and it arrives sooner than people expect. Separate suites for front end and back end. The same suite on iOS and Android. Dev and staging. Each of those is its own job with its own results, and once there are several, no single report answers "are we healthy" any more. That question only has an answer at a level above the individual job.
Someone other than the test author needs the results. The moment a QA lead, a manager, or a developer who did not run the suite needs to know what happened, a log that requires CI access and a scroll through console output is a bad interface. Results the team can look at directly is the actual requirement.
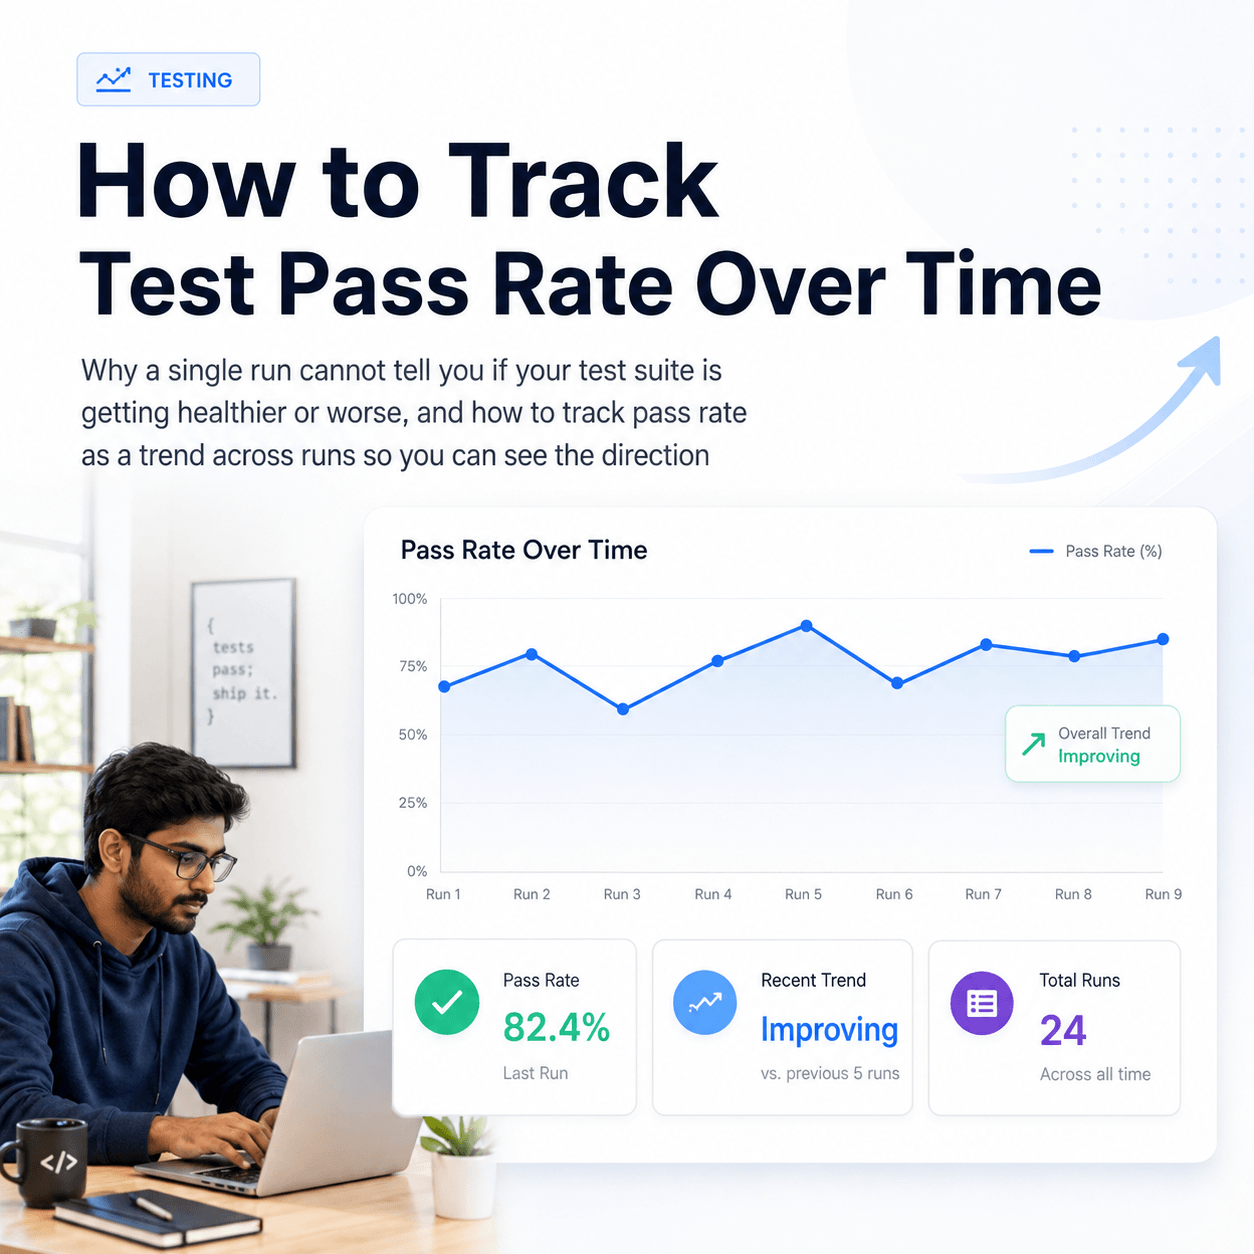
You need to know what a test did before today. Whether a failure is new, whether a test has been quietly flaky for a fortnight, whether pass rate is trending down since the release. None of these are answerable from a single run, no matter how good the report for that run is. They need history, which means a place results are kept.
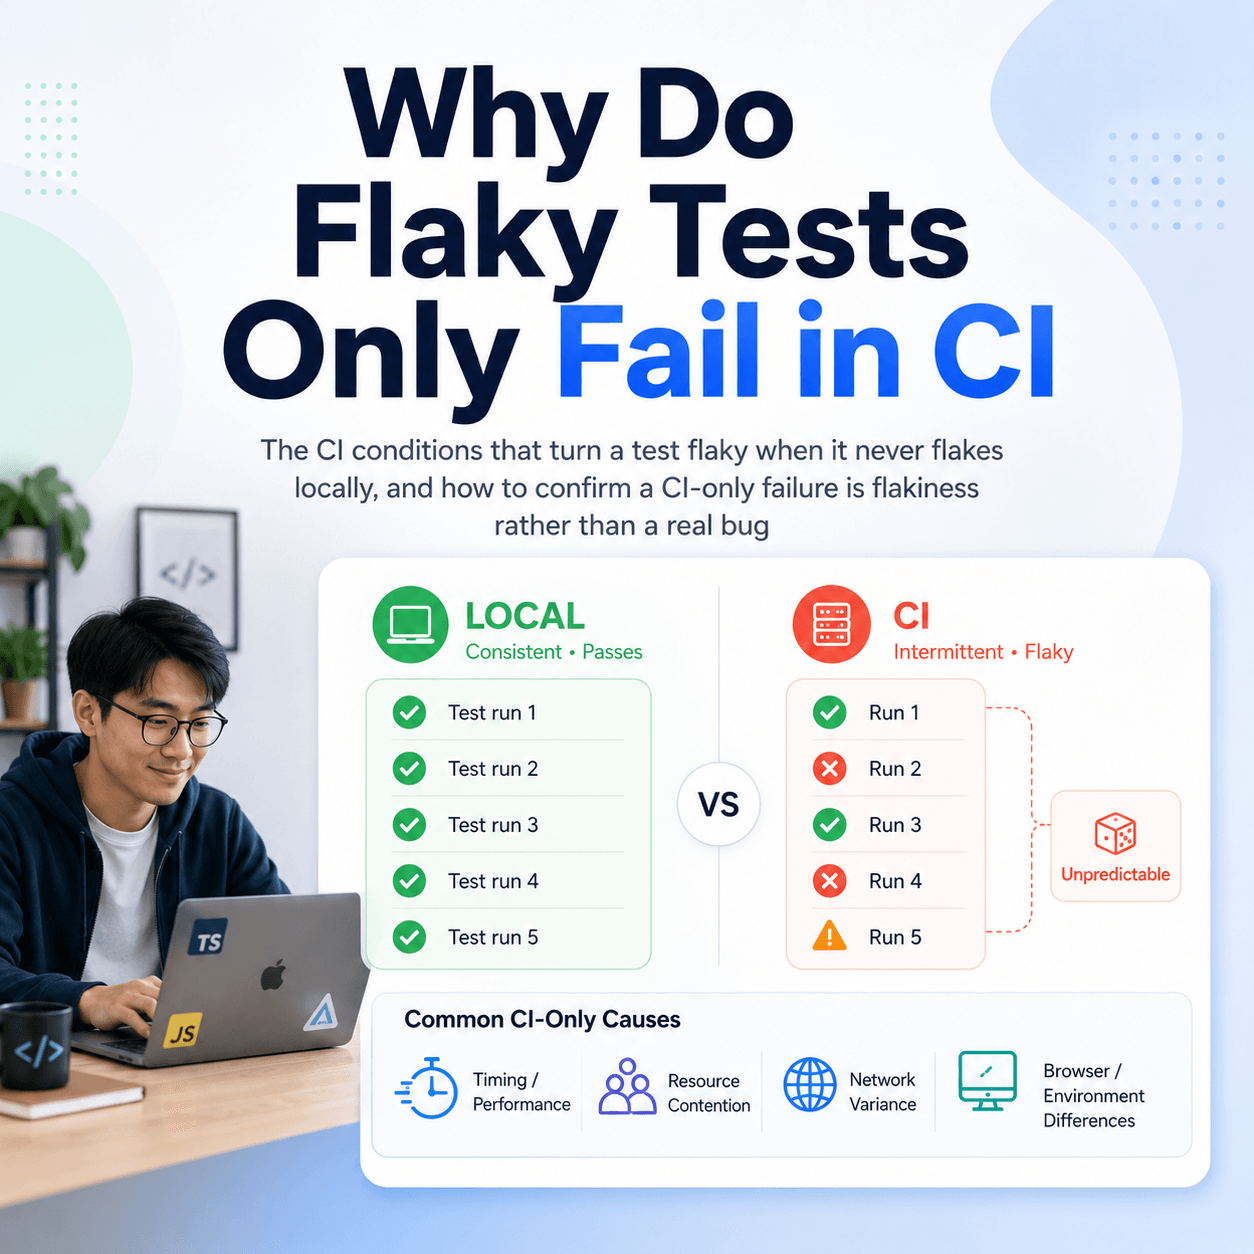
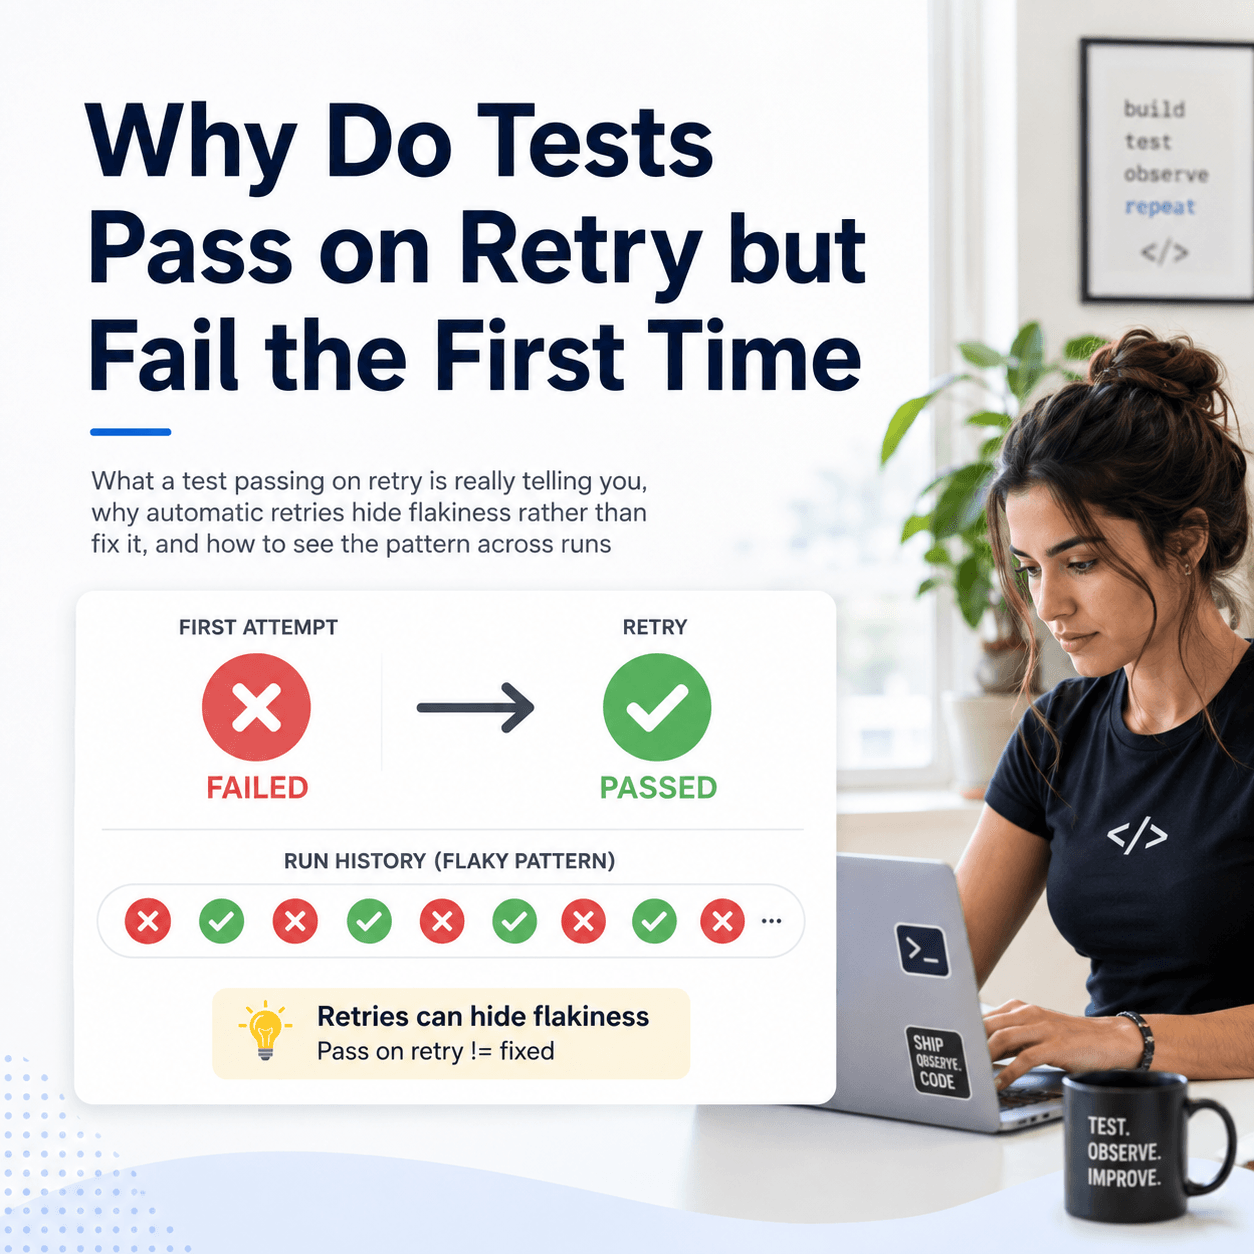
You are chasing failures that will not sit still. Intermittent failures cannot be diagnosed from one run by definition, because the definition of the problem is that the result varies across runs. Seeing that pattern requires having the runs.
What does it give you that one run cannot?
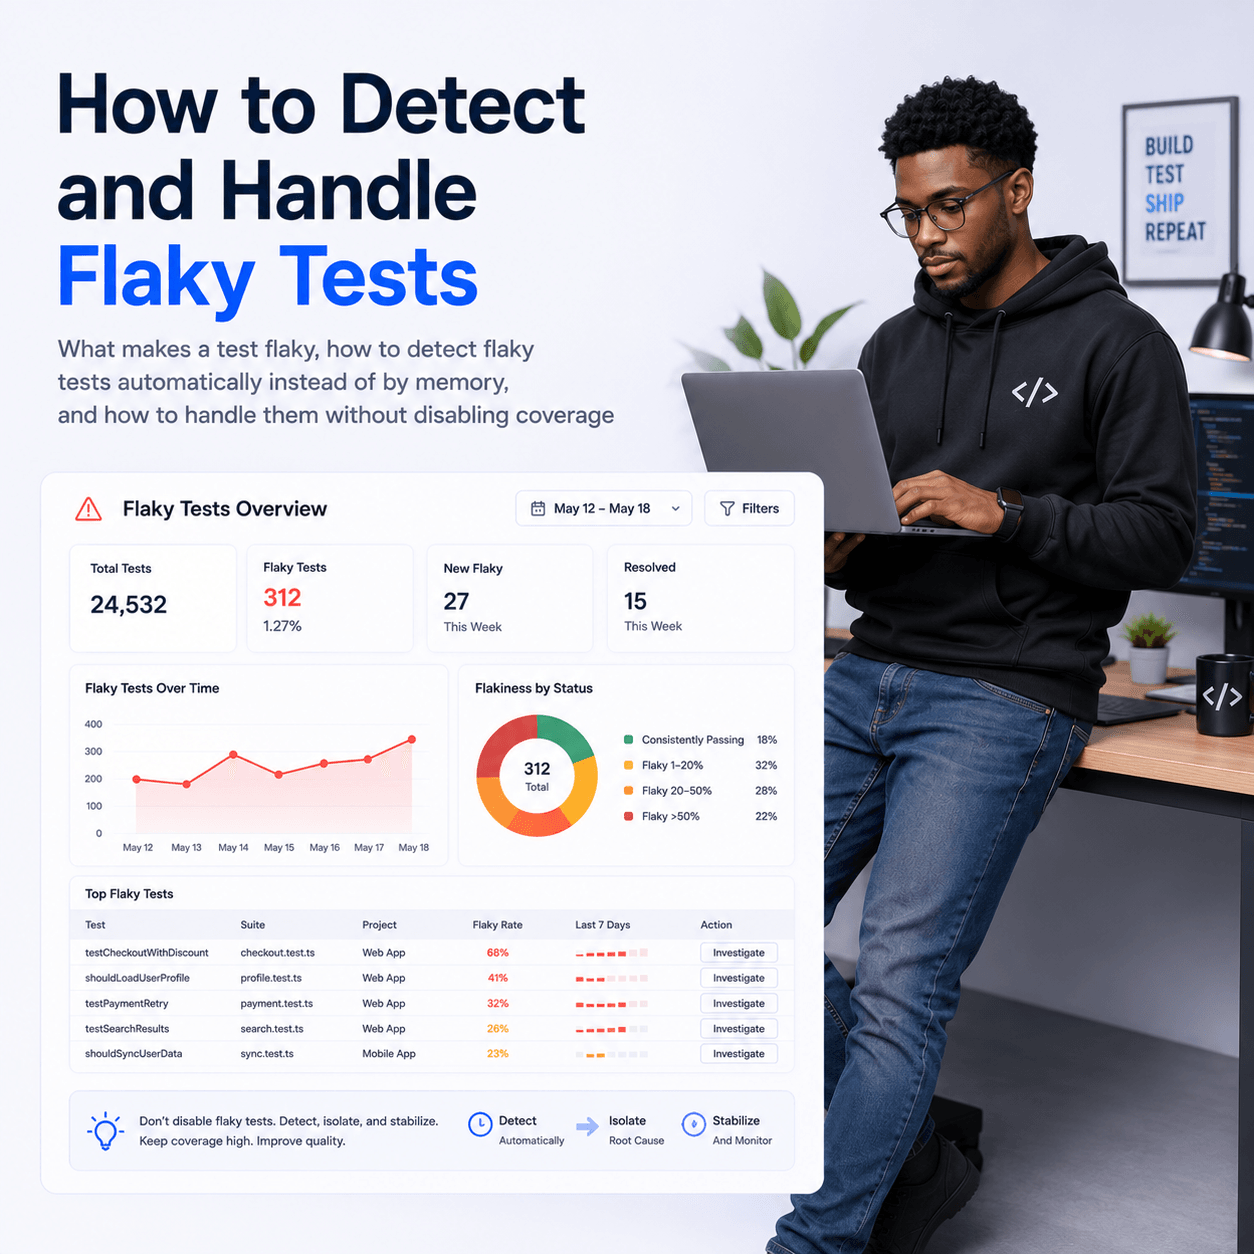
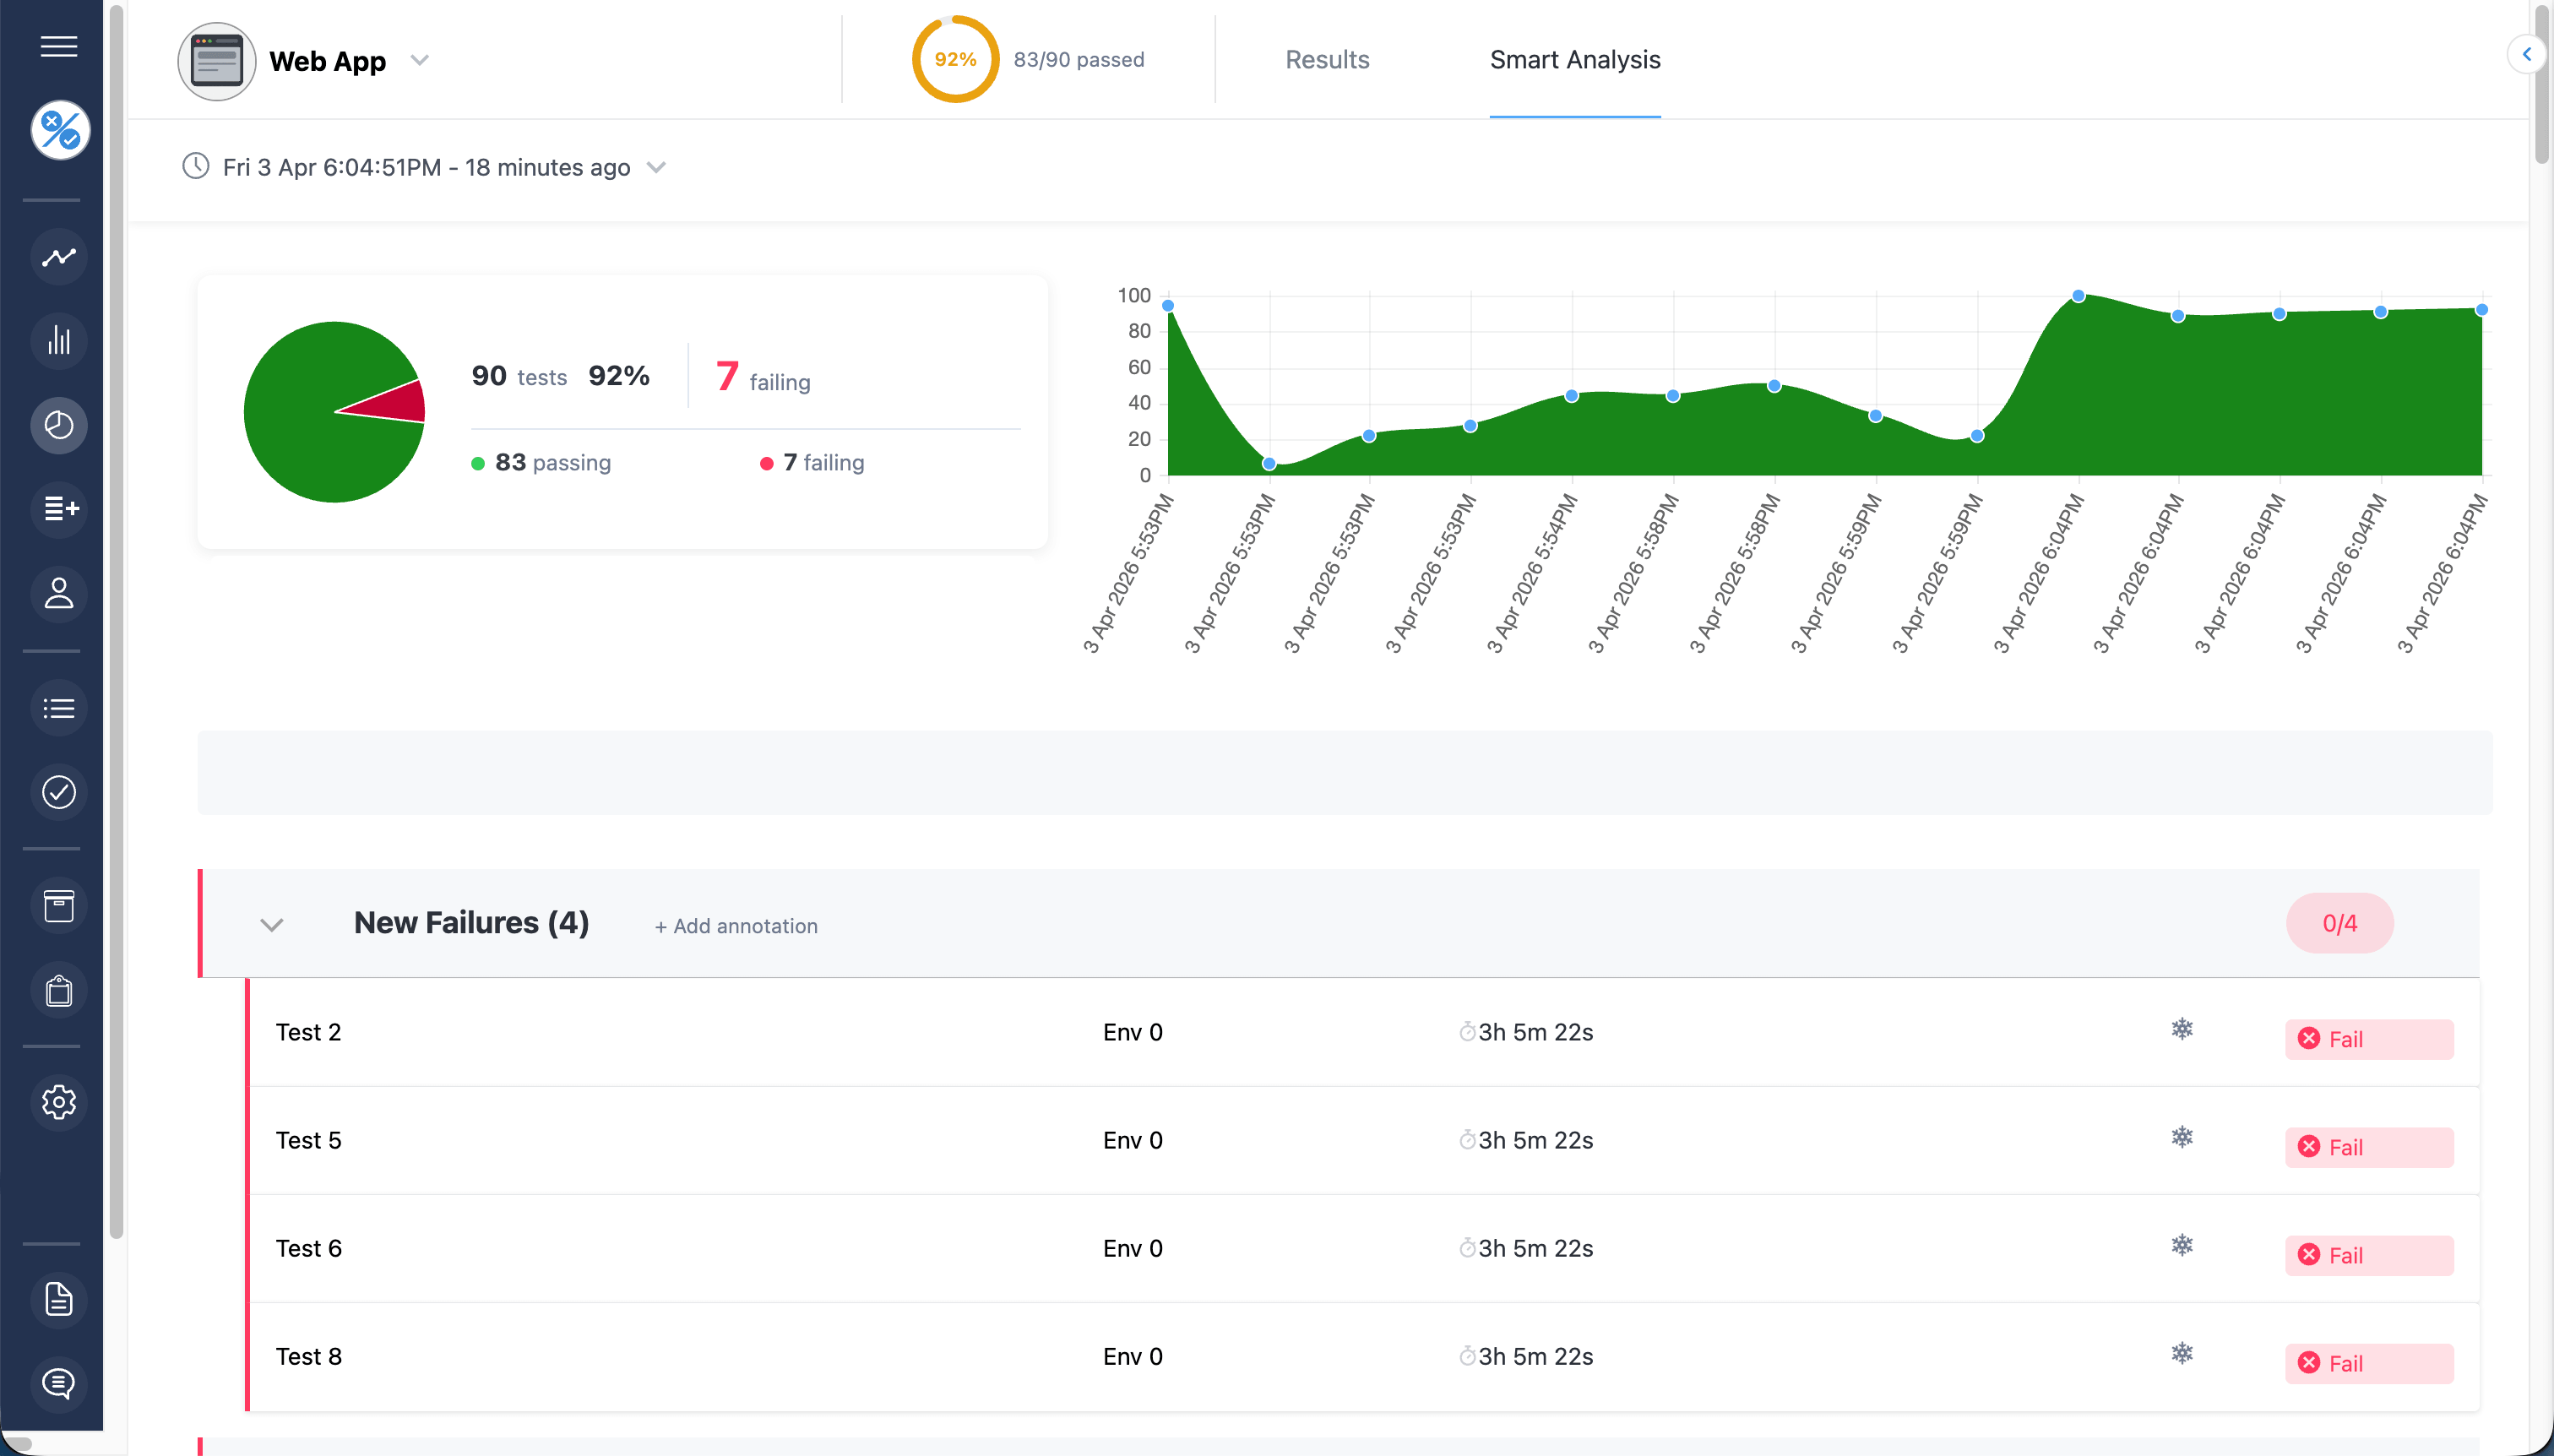
Once results accumulate, questions that were impossible become routine. In Tesults this analysis sits in the supplemental view, which focuses on key metrics rather than listing every case: which test cases have just started failing, which have just started passing, which are continuing to fail, and which are flaky, along with the trajectory of pass rates across recent runs.
Read that list again as questions a team actually asks in a stand up. Did we break anything since yesterday. Did the fix work. What has been red for a while and are we ignoring it. Is quality drifting. Every one of them is a comparison across runs, and every one is unanswerable from a report on a single run. That is the whole argument for a dashboard in one paragraph.
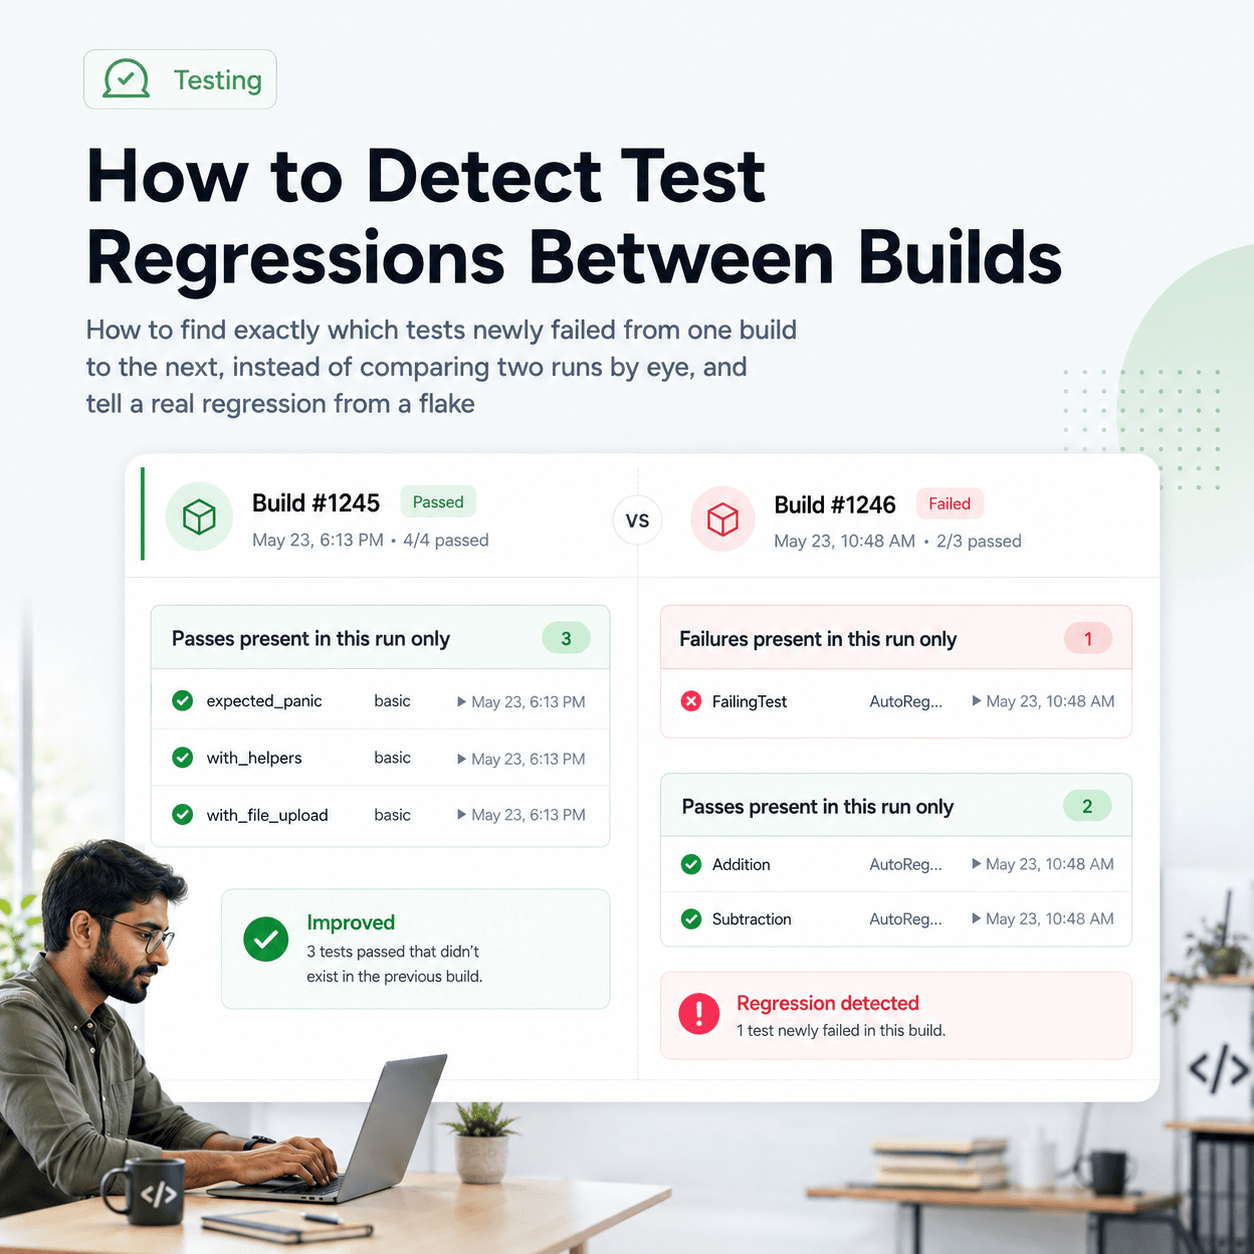
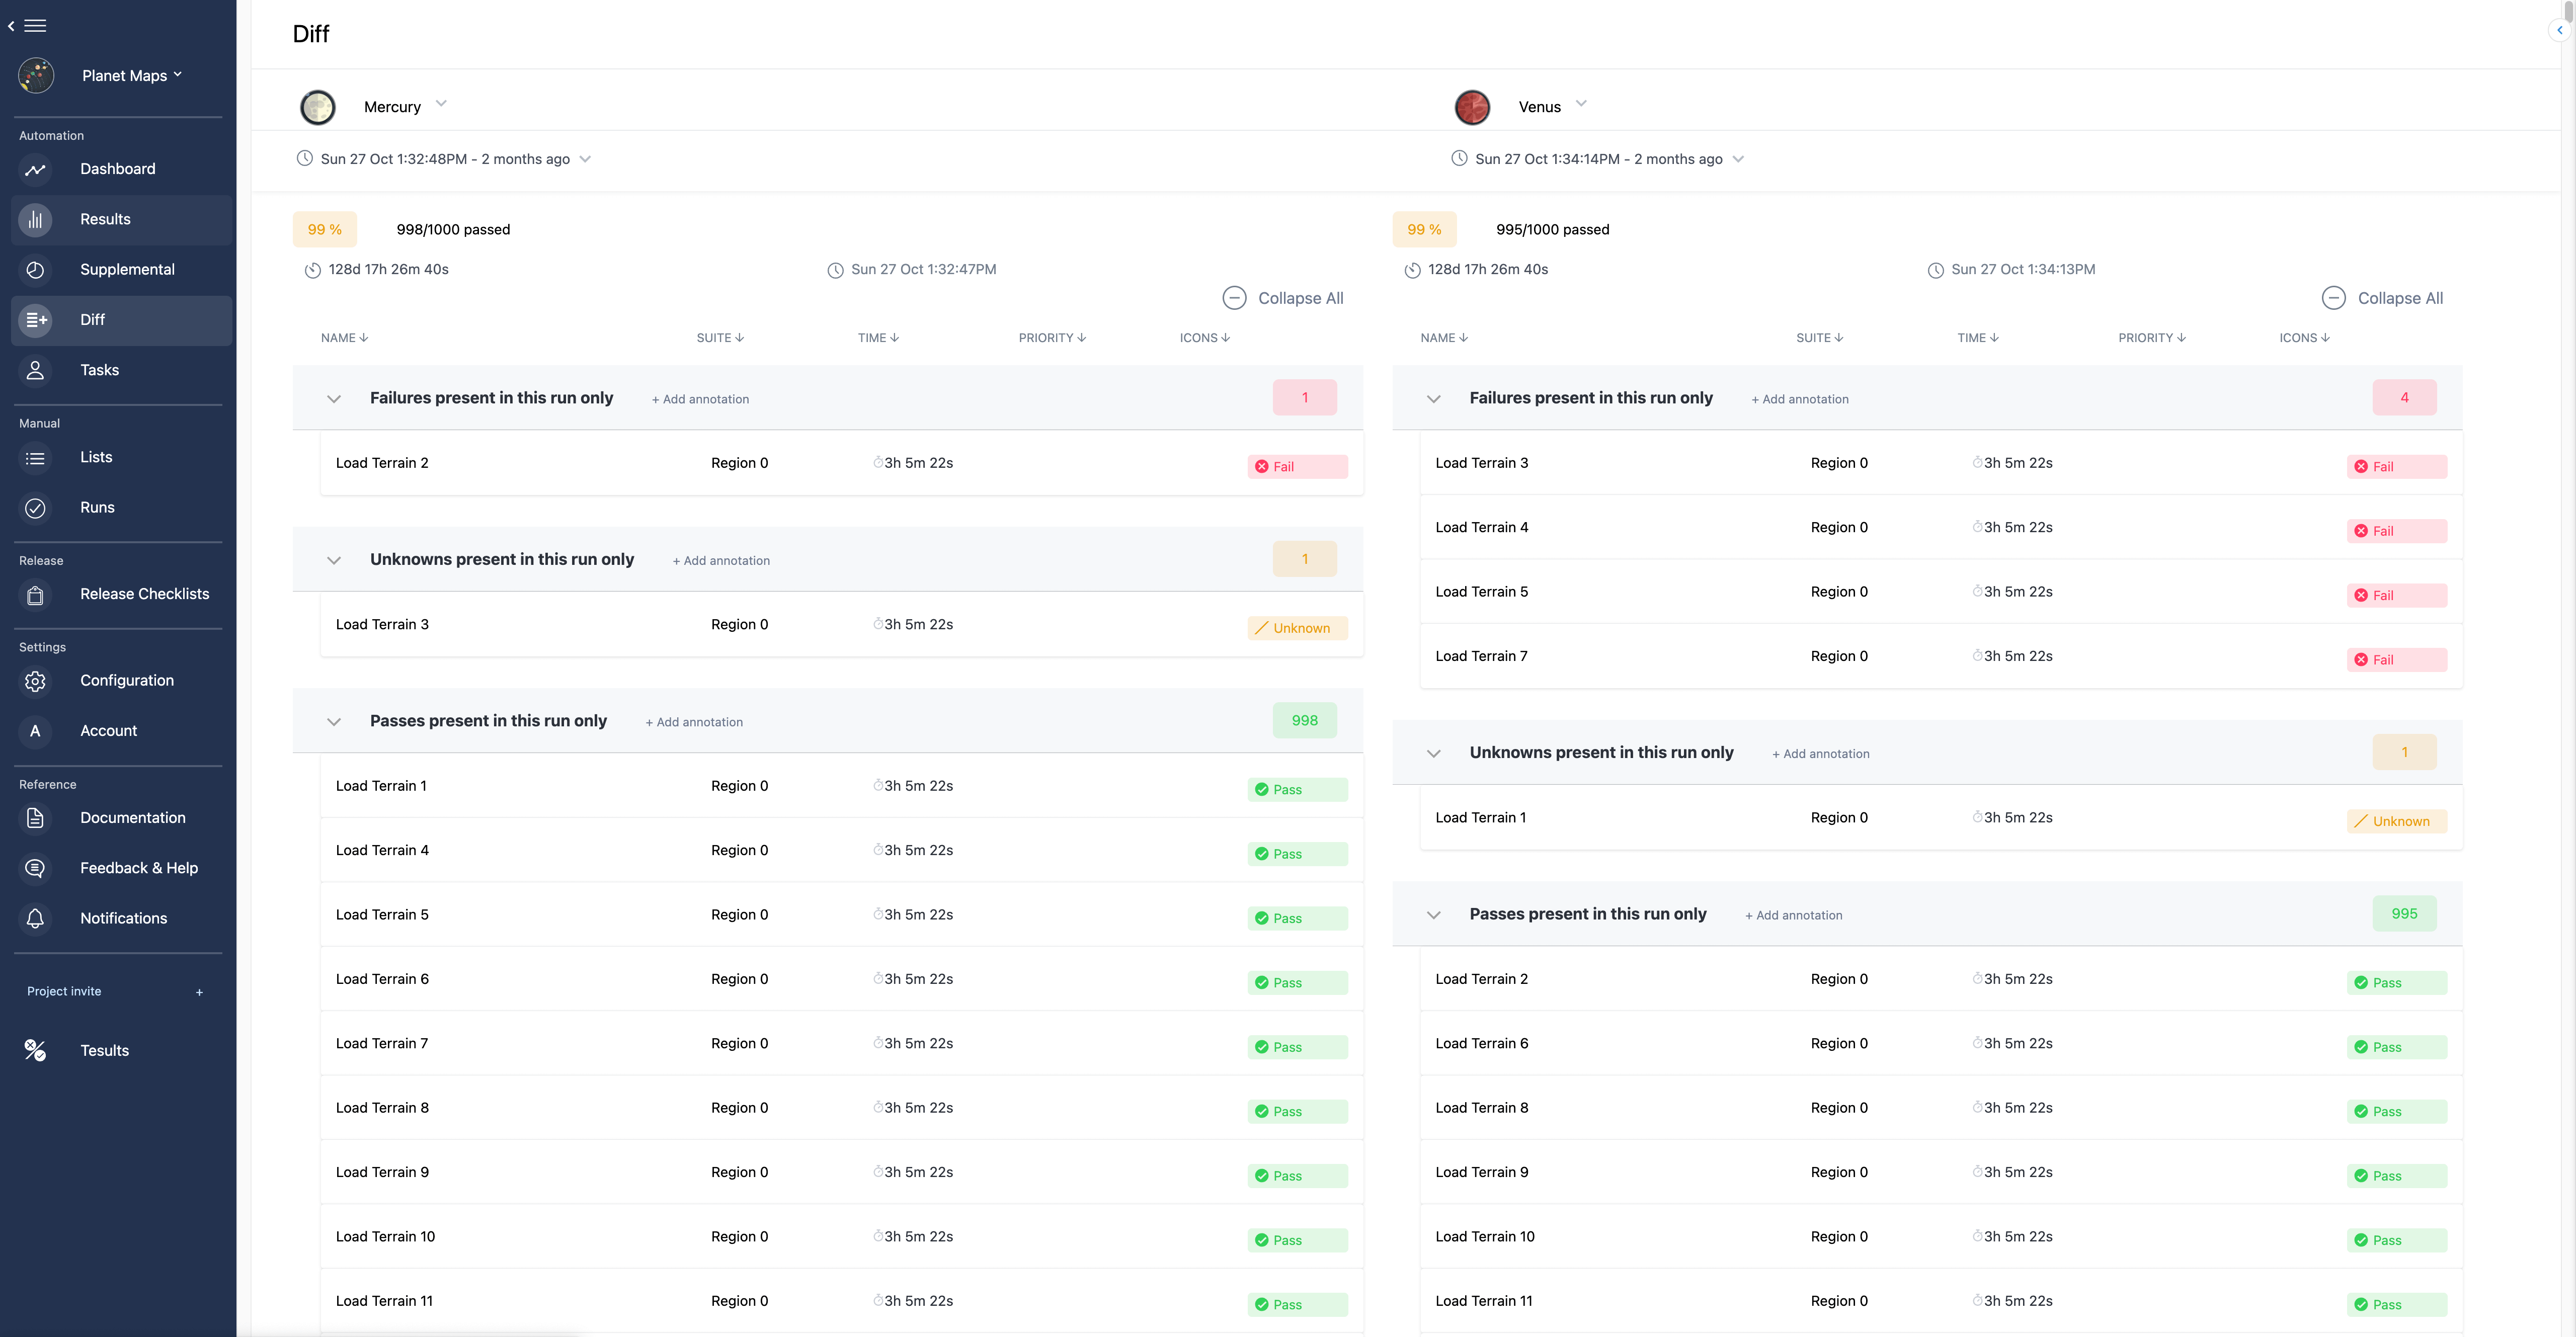
The diff view takes the same idea further by putting two sets of results side by side and highlighting the differences automatically. Keep one target selected and change the run to compare the same job at two points in time. Change the target on one side to compare two different jobs that share the same test cases, which is how you answer why a suite passes in staging and fails in dev without opening two tabs and comparing by eye.
What makes a dashboard useful rather than just present?
A dashboard nobody opens is not doing anything, and the difference usually comes down to two things.
Results have to be organised the way your team thinks. Every test job should push to its own target, and it is worth taking seriously that pushing everything into fewer targets than you have jobs breaks the analysis. Historical trends, regression detection, and flaky classification all work by comparing like with like across runs, and that comparison is only meaningful within a target. A target maps one to one with a test job, and can represent whatever dimension matters to you: environment, platform, browser, branch, build flavour, test type, even an individual robot in a fleet.
It has to stay readable as it grows. A project with twenty targets in a flat list is a wall. Grouping fixes this: tag targets into groups and filter the dashboard to just those, and a target can sit in more than one group at once, so an iOS debug job can appear under both iOS and Debug. Grouped views can be shared as links, which is what makes a dashboard something a squad opens rather than something one person maintains.
Do you need one if you already have AI analysis or an API?
These are complements, not substitutes, and the split is clean. Automation is right for the questions asked on every run, gating a deploy on new failures, posting what changed on a pull request, letting an agent verify its own change. Those should never require a person to look at anything.
The dashboard is where a person goes when automation has decided a person is needed. When a gate blocks, someone opens the failing run with its history and its attached screenshots and logs, rather than reconstructing the story from a console. The two are the same data at different ends: computed answers pushed to the pipeline, and a view for the human the pipeline just paged. A team that has one and not the other feels the gap quickly.
The short version: a dashboard is what turns test results from output into a record. If you have one suite, one runner, and one person, you do not need that yet. As soon as you have several jobs, teammates who need to see the results, or any question that starts with "when did this start", you need the results kept somewhere that can answer it, and that place is a dashboard. The views described here are documented in the Tesults dashboard documentation, with the analysis views covered under supplemental and the structure that makes them work explained in what are targets.