Cypress Test Reporting - Beyond the Built-in Reporters
What Cypress's built-in reporters give you and where they fall short
May 17, 2026
If you're using Cypress for end-to-end testing, you already know it's one of the best tools available for testing web applications. The developer experience is excellent, the built-in test runner gives you real-time feedback as your tests run, and the automatic screenshots and videos on failure are genuinely useful for debugging.
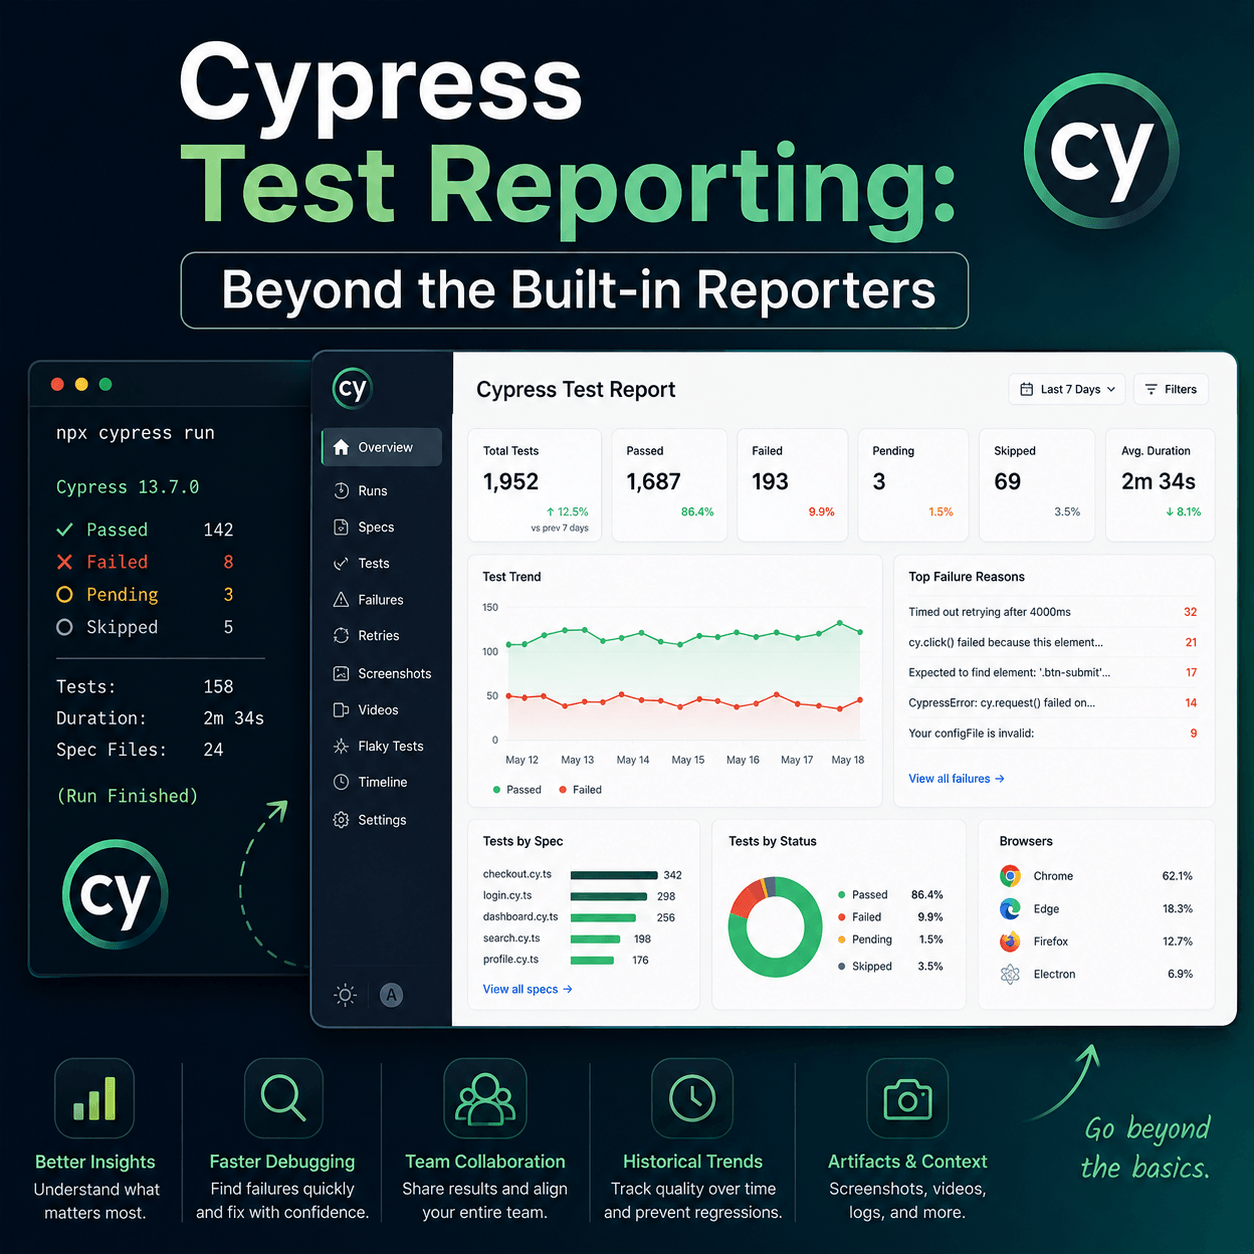
But like most test frameworks, Cypress's default reporting only tells you what happened right now — not what's been happening over time. This post covers where Cypress's built-in reporter falls short for teams running tests in CI, and how to set up proper reporting that gives you history, trends, and team visibility.
What Cypress's Default Reporter Gives You
Out of the box Cypress uses the spec reporter, which prints test results to the terminal as tests run. It shows which tests passed, which failed, failure details, and a summary at the end. When running headlessly in CI, Cypress also generates video recordings of each spec and screenshots of any failures.
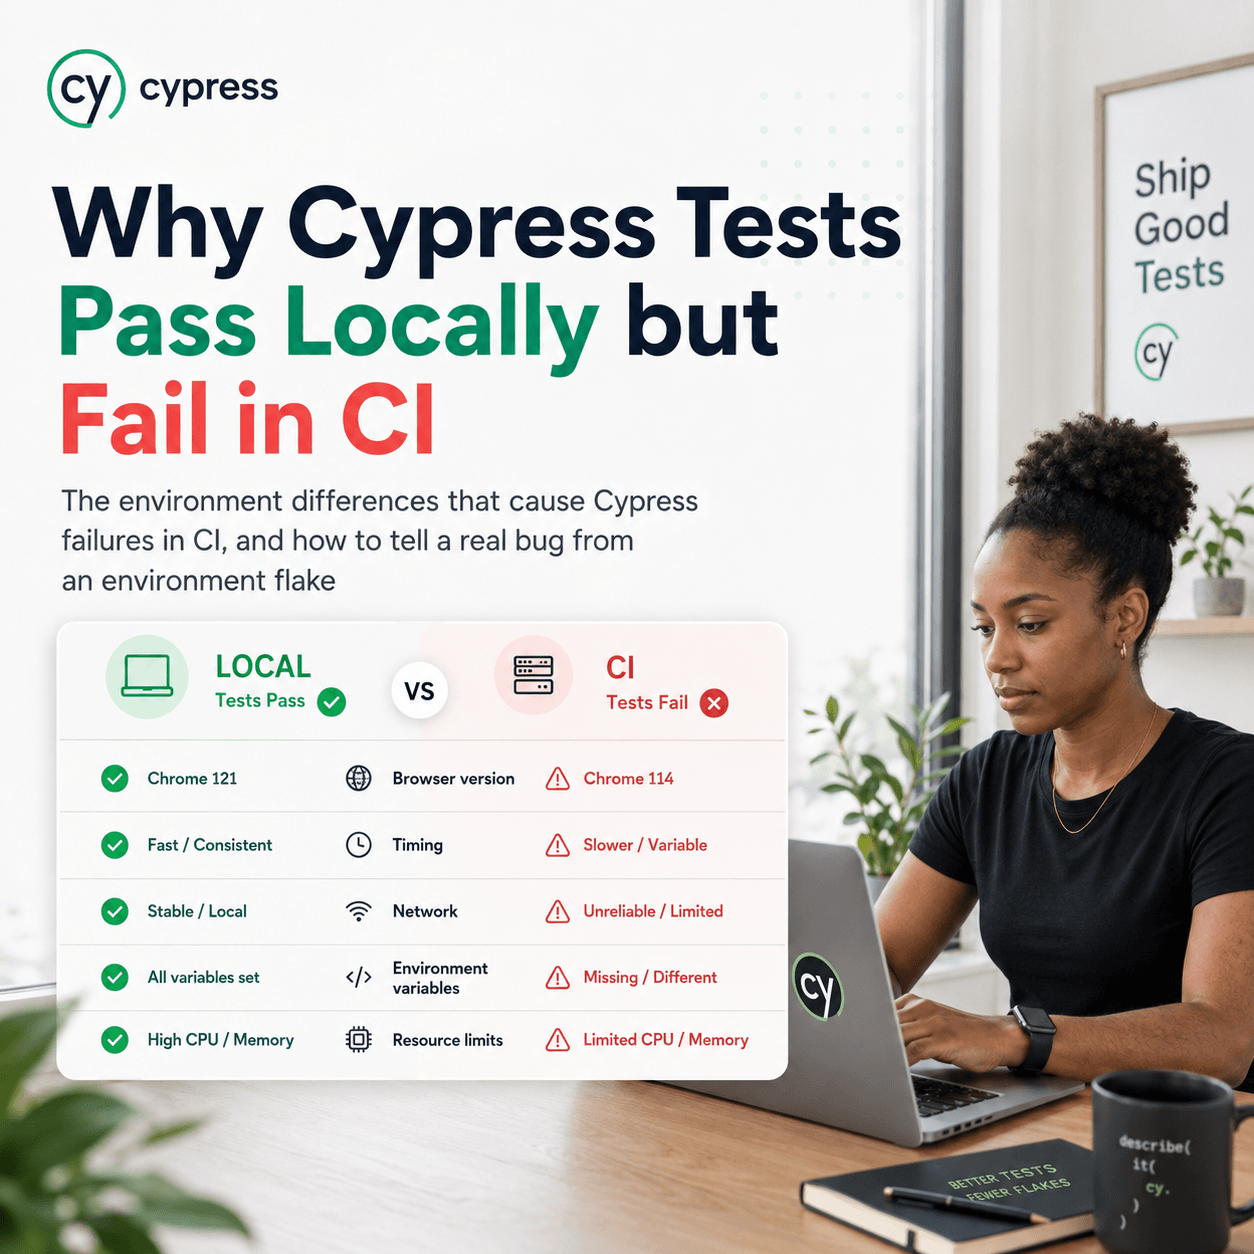
For local development this is exactly what you need. You can see failures immediately, watch the browser, and fix issues quickly. The limitations appear when you move to CI and start caring about more than just today's run.
No History
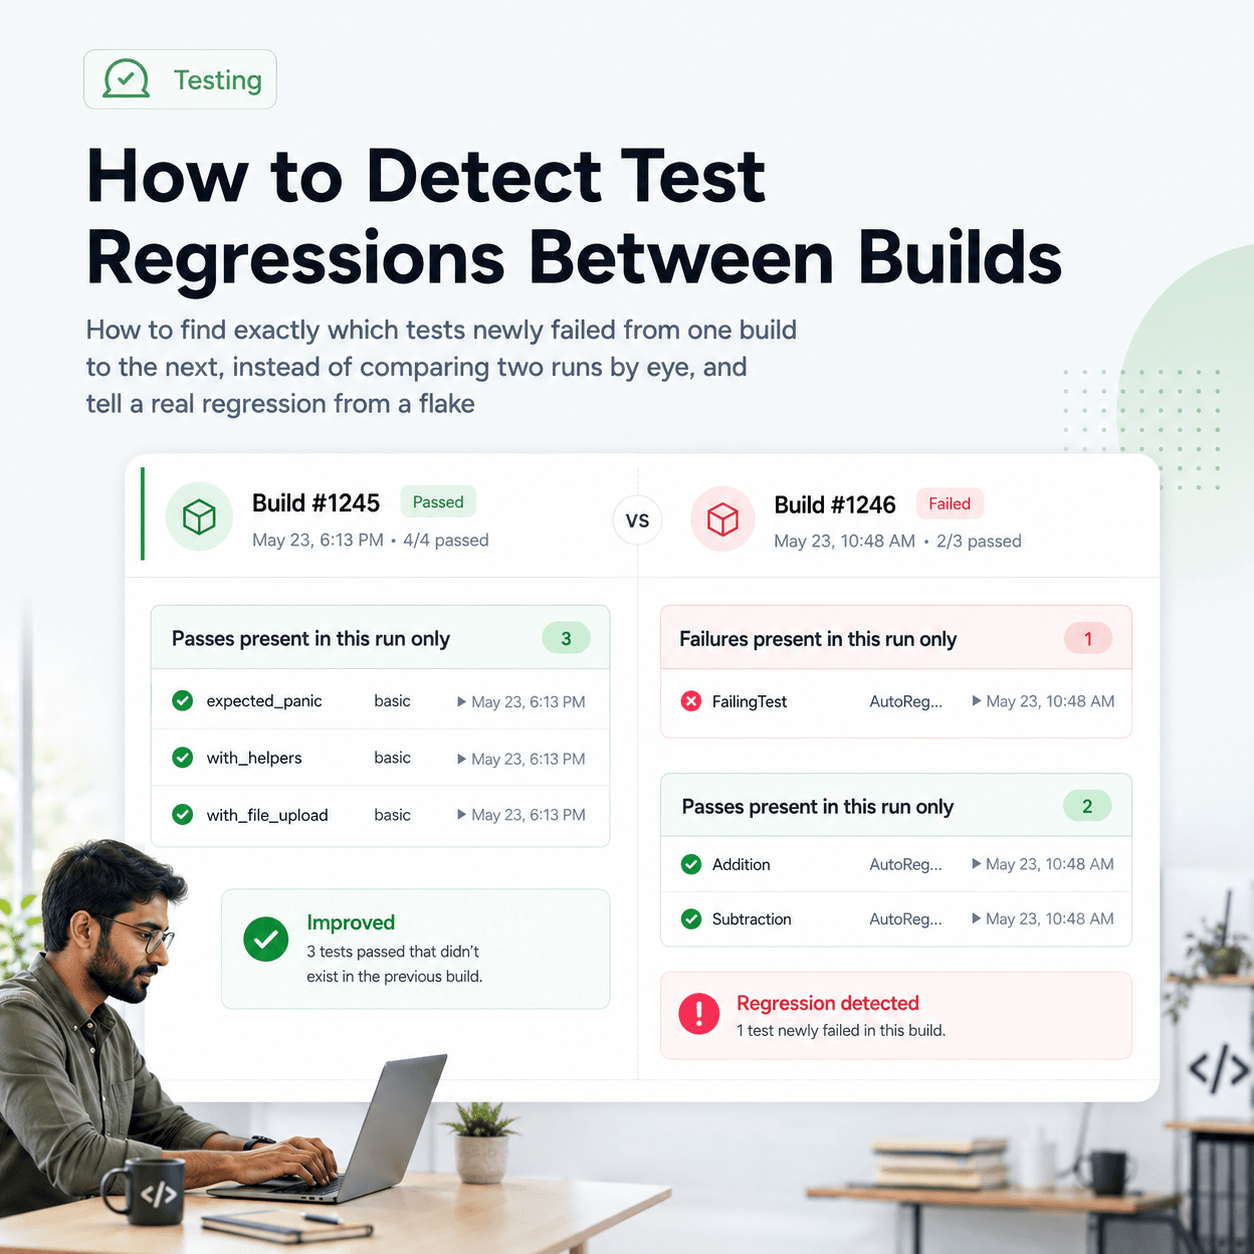
Every Cypress run starts fresh. The spec reporter shows you what happened in this run — nothing more. There's no record of whether that failing test was also failing last week, whether it started failing after a specific deployment, or whether it's been intermittently failing for months.
When a test fails in CI, the first question is almost always "is this new or has it been failing?" Without stored history, you can't answer that without digging through old CI logs manually.
No Trend Data
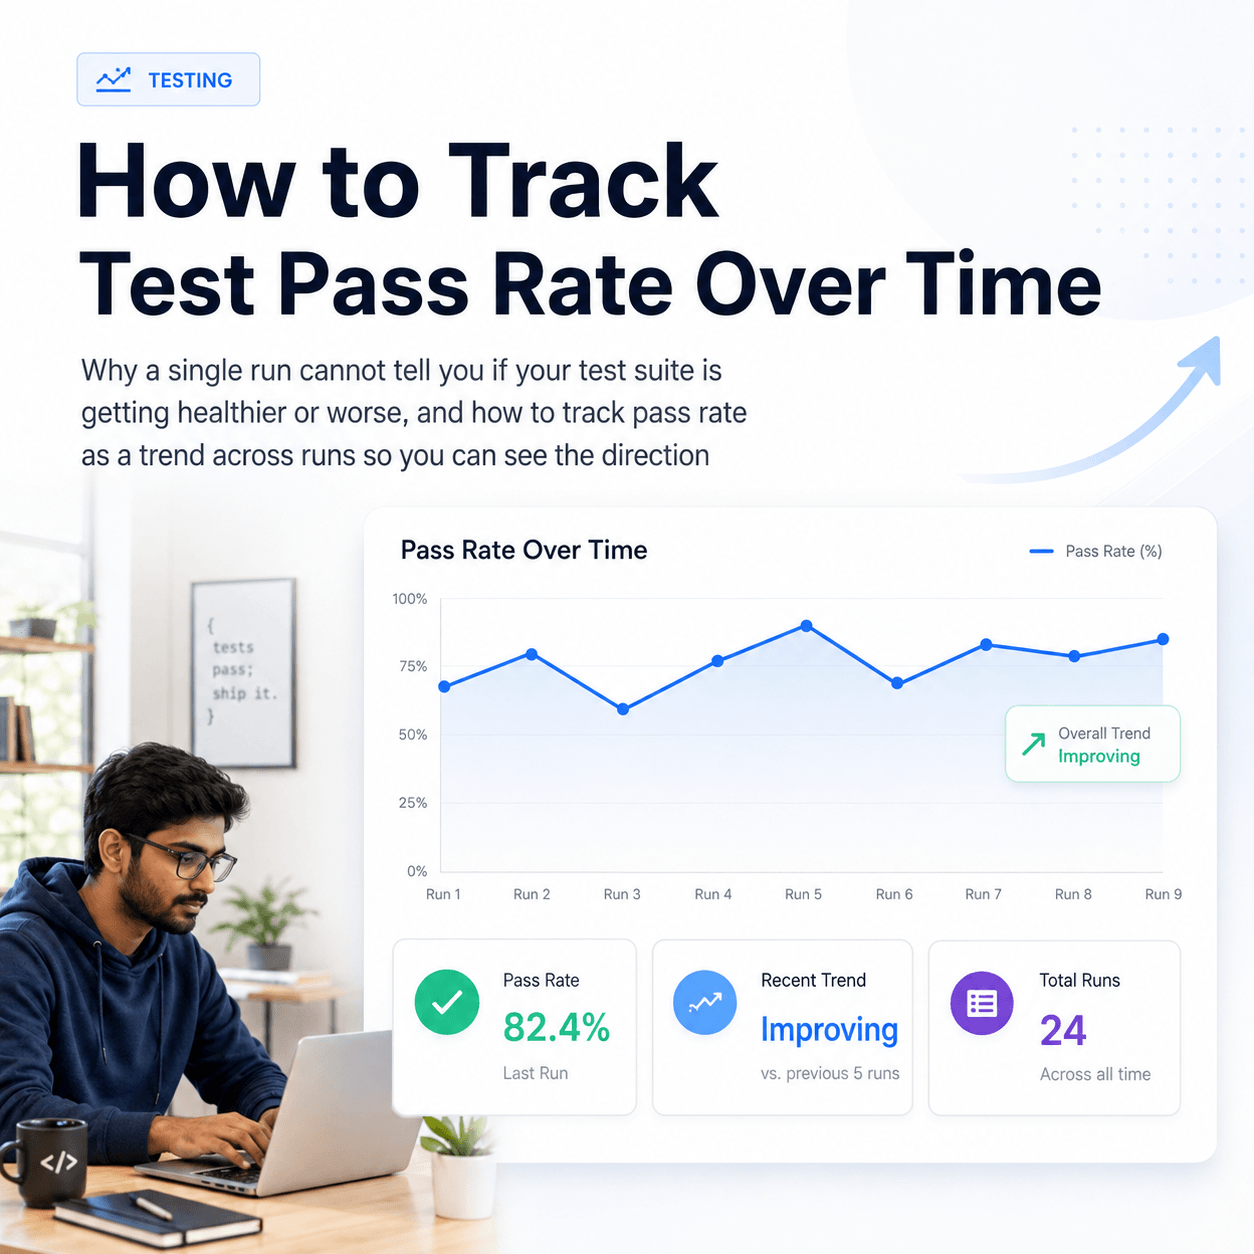
Is your test suite getting more stable or less stable over time? Are you introducing new failures faster than you're fixing old ones? Without persistent storage of results across runs, these questions are impossible to answer. You're flying blind on the health trajectory of your test suite.
No Team Visibility
Cypress's terminal output and generated artifacts live in your CI system, accessible mainly to engineers who know where to look. Product managers, QA leads, and other stakeholders who care about software quality have no easy way to see what's being tested and what's failing without digging through CI pipelines.
No Flaky Test Detection
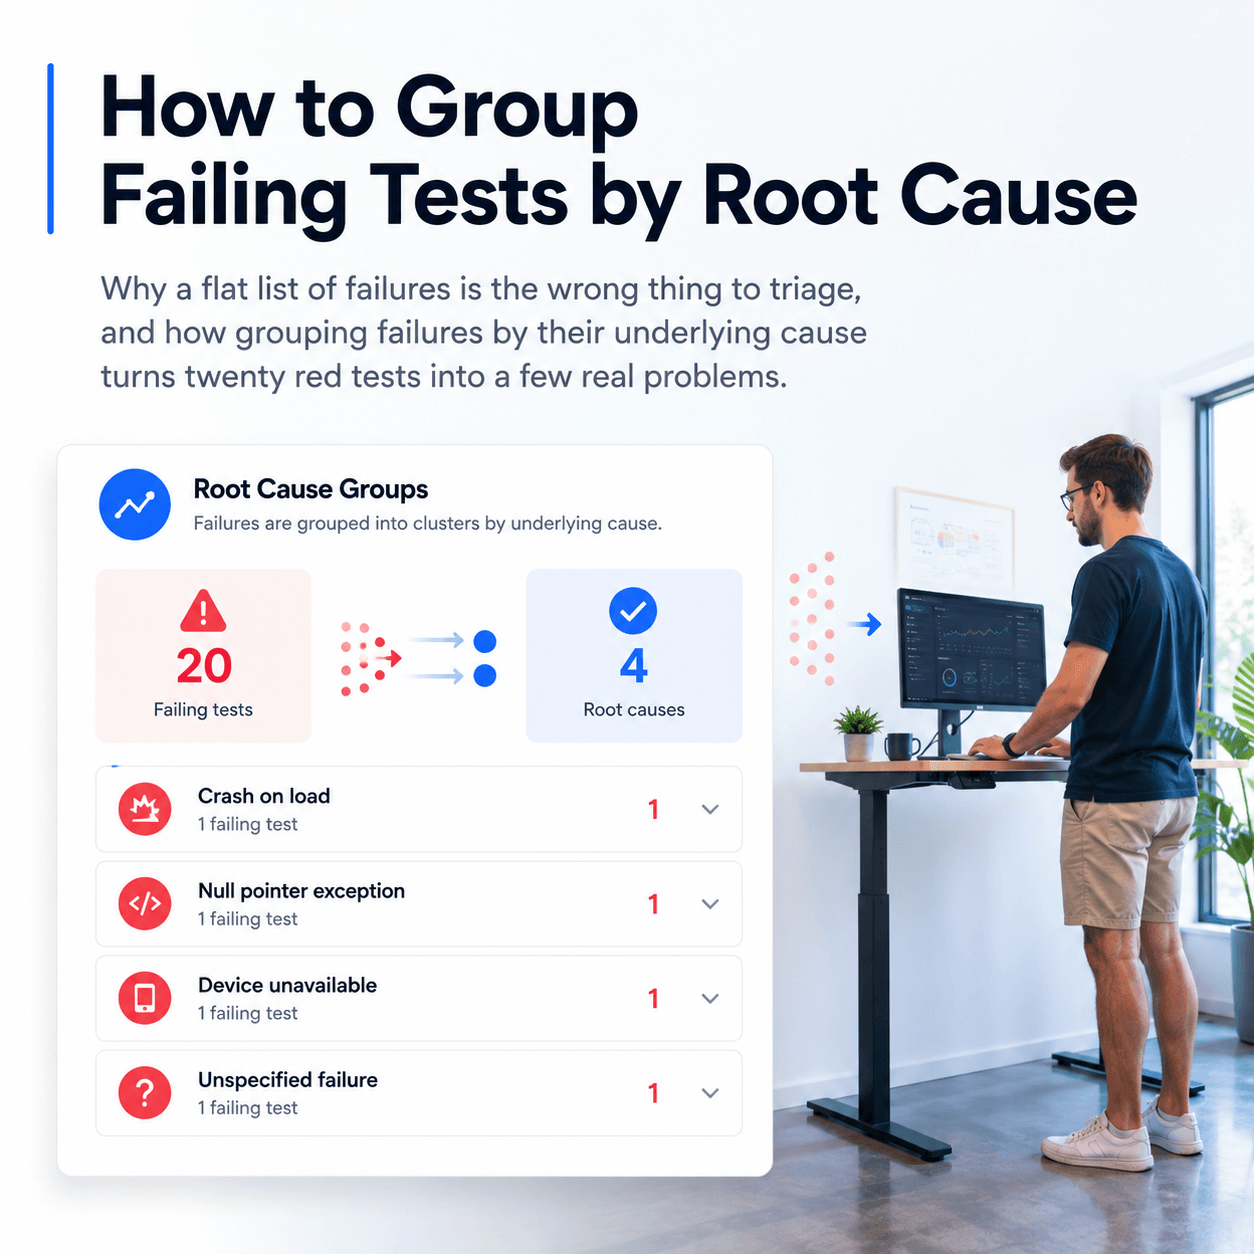
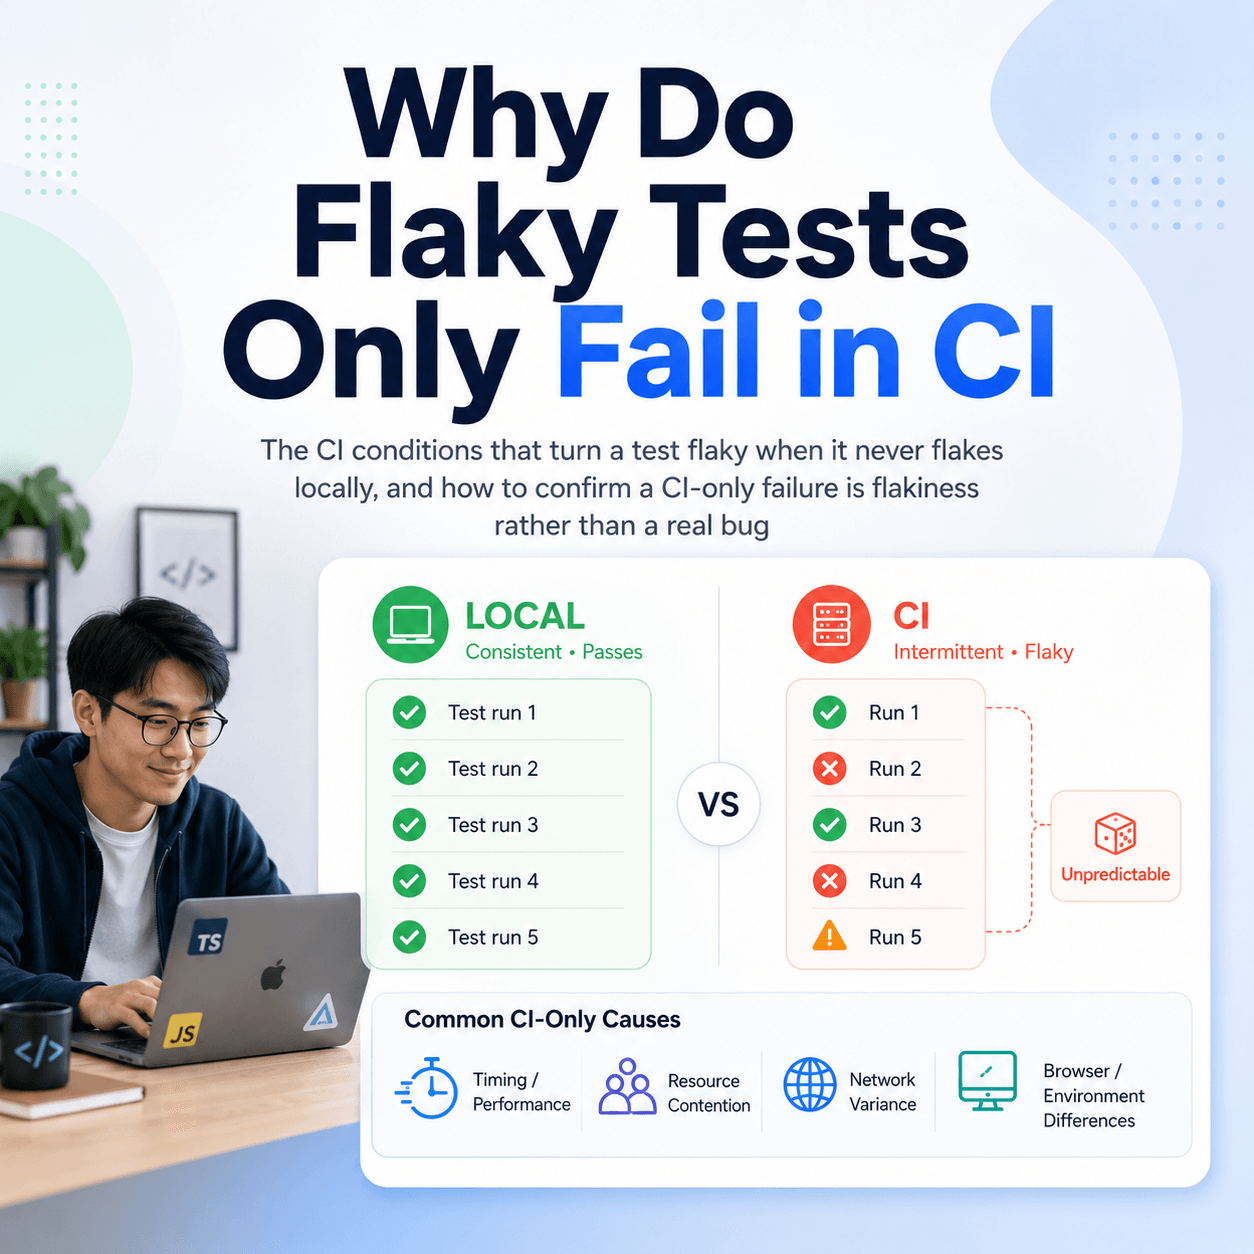
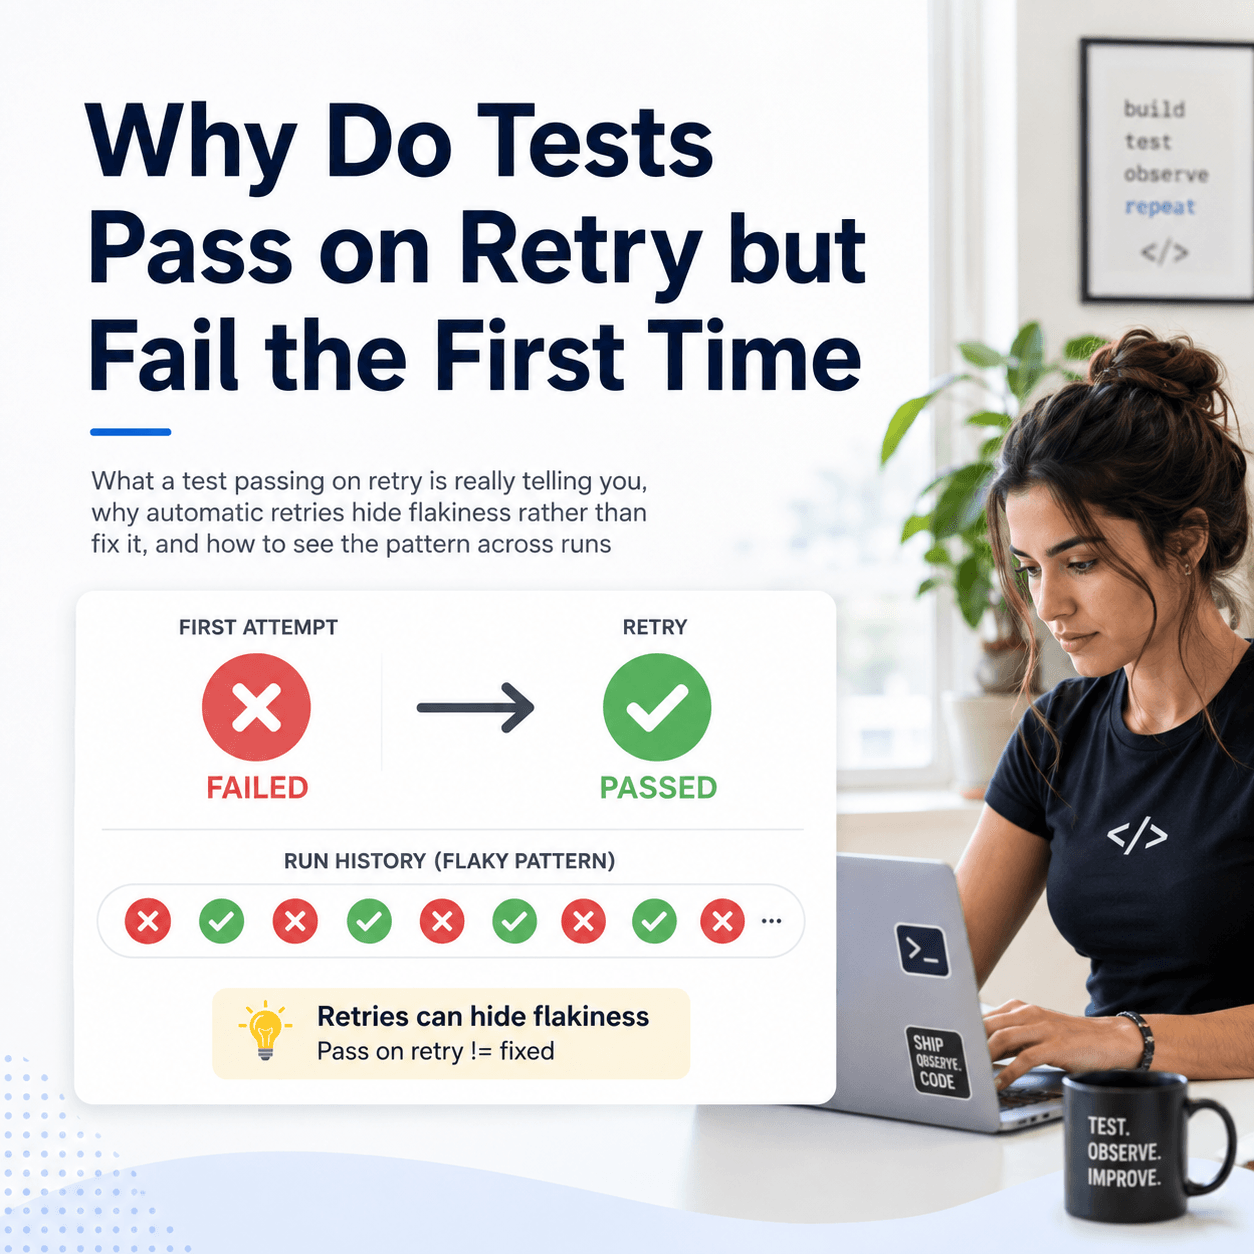
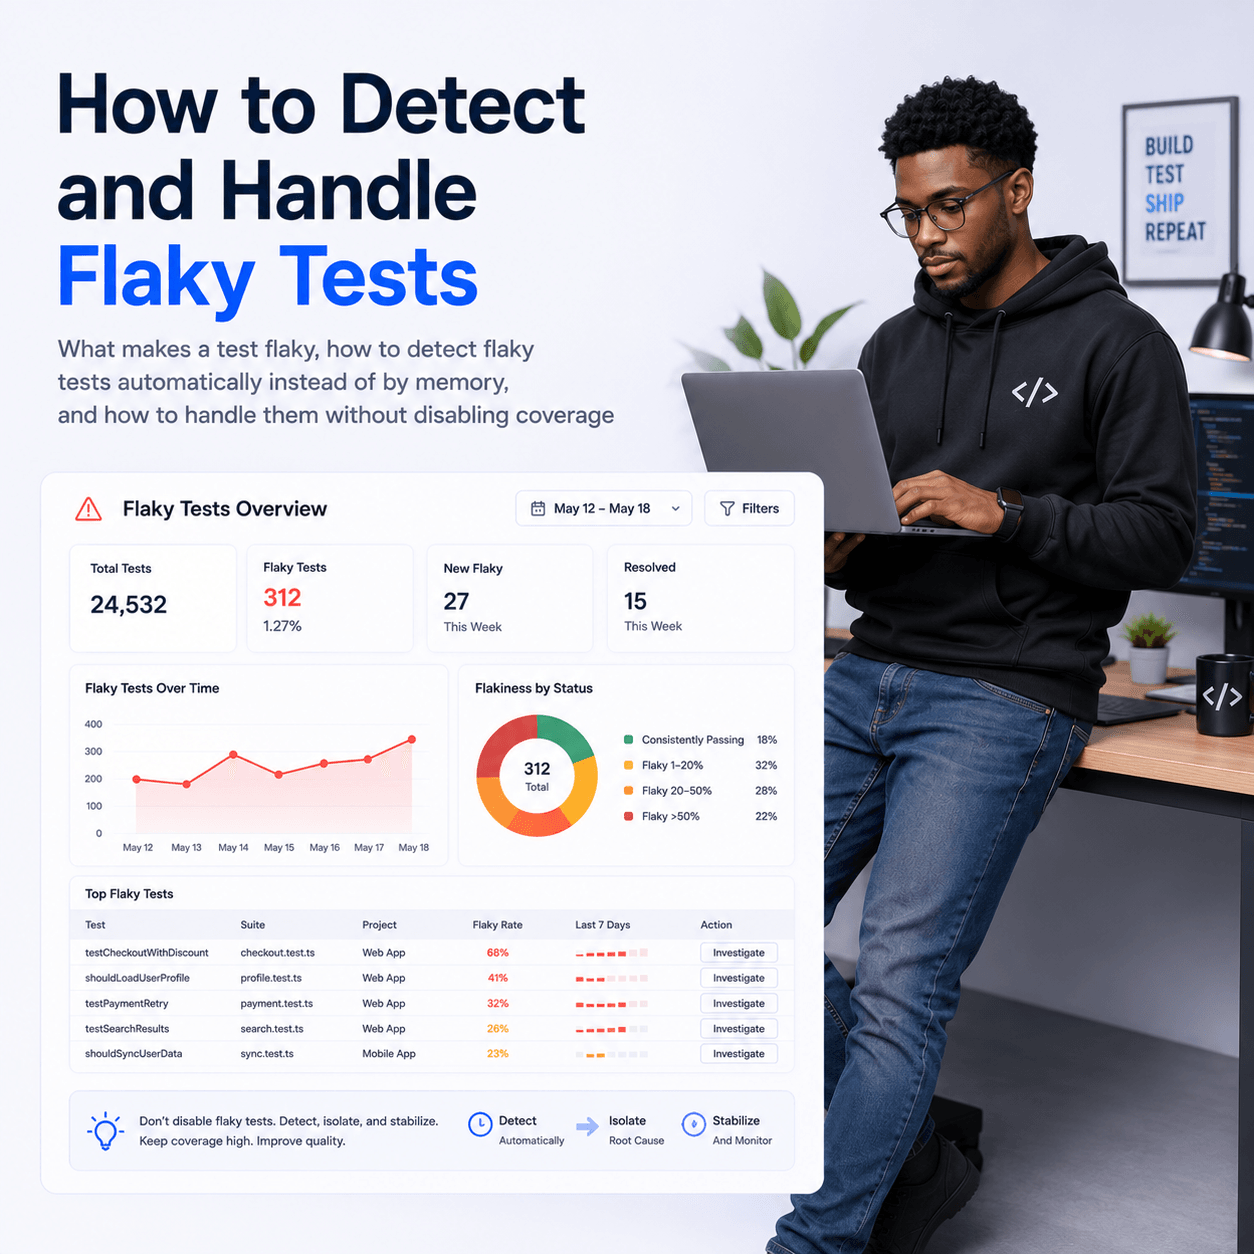
Flaky tests — tests that pass sometimes and fail other times without any code changes — are one of the biggest sources of noise in a test suite. They erode trust and waste engineering time investigating failures that aren't real regressions. Cypress's default reporter can't identify flaky tests because it has no memory between runs. Every run is evaluated in isolation.
What Good Cypress Test Reporting Looks Like
A proper reporting setup for teams running Cypress in CI gives you results stored persistently across every run. It gives you trend visibility so you can see pass rates and failure rates over time. It gives your whole team a shared dashboard — a single URL anyone can visit to see the current state of test health. And it automatically surfaces flaky tests rather than hiding them in noise.
Setting Up Cypress with Tesults
Tesults is a test results dashboard built for exactly this purpose. It stores results persistently, tracks trends over time, and gives your whole team visibility into test health. Setup with Cypress takes around five minutes.
Install the reporter:
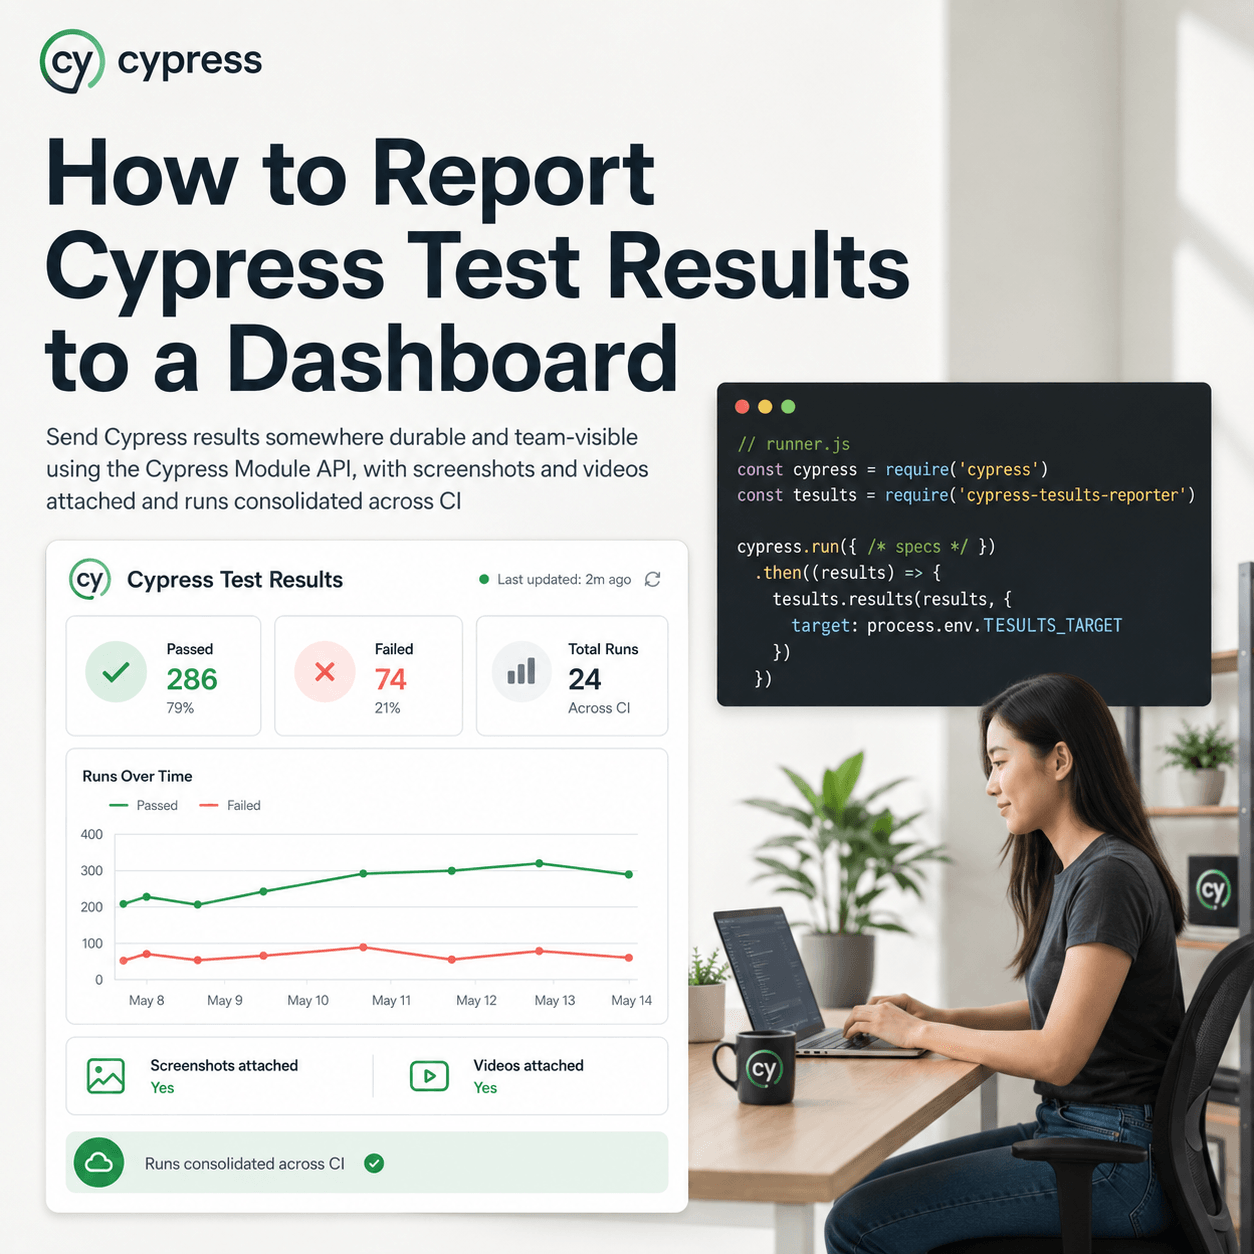
npm install cypress-tesults-reporter --saveThe Cypress Tesults Reporter uses the Cypress Module API, so you start Cypress from a runner file rather than directly from the command line. Create a runner.js file with this content:
const cypress = require('cypress')
const tesults = require('cypress-tesults-reporter');

cypress.run({
  // specs to run here
})
.then((results) => {
  const args = {
    target: 'token',
  }
  tesults.results(results, args);
})
.catch((err) => {
  console.error(err)
})
Replace token with your Tesults target token, available from the configuration menu within Tesults. You can create a free project at tesults.com. Then run your tests via the runner:
node runner.jsAfter your tests complete, results are pushed to Tesults automatically. That's the basic setup done.
Screenshots and Videos
Any screenshots and videos taken using built-in Cypress functions will be automatically saved to Tesults alongside your test results. This means failure screenshots and video recordings are stored permanently and accessible from the Tesults dashboard — not just in CI artifacts that expire after 30 days.
Including Build Information
If you're running Cypress as part of a CI pipeline, you can optionally include build information in the args. This is useful for correlating test results with specific builds or releases:
const args = {
  target: 'eyJ0eXAi...',
  build_name: '1.0.0',
  build_result: 'pass',
  build_description: 'Build description',
  build_reason: 'If failed, provide reason here'
}
Parallel Runs and Build Consolidation
If you're running Cypress specs in parallel across multiple machines, each run submits results to Tesults separately by default. Tesults has a build consolidation feature that automatically merges results from parallel runs with the same build name into a single unified test run. This gives you one coherent view of a parallel test execution rather than fragmented results spread across multiple runs.
Enable build consolidation from the Configuration menu within Tesults, then set the same build_name across all your parallel runners.
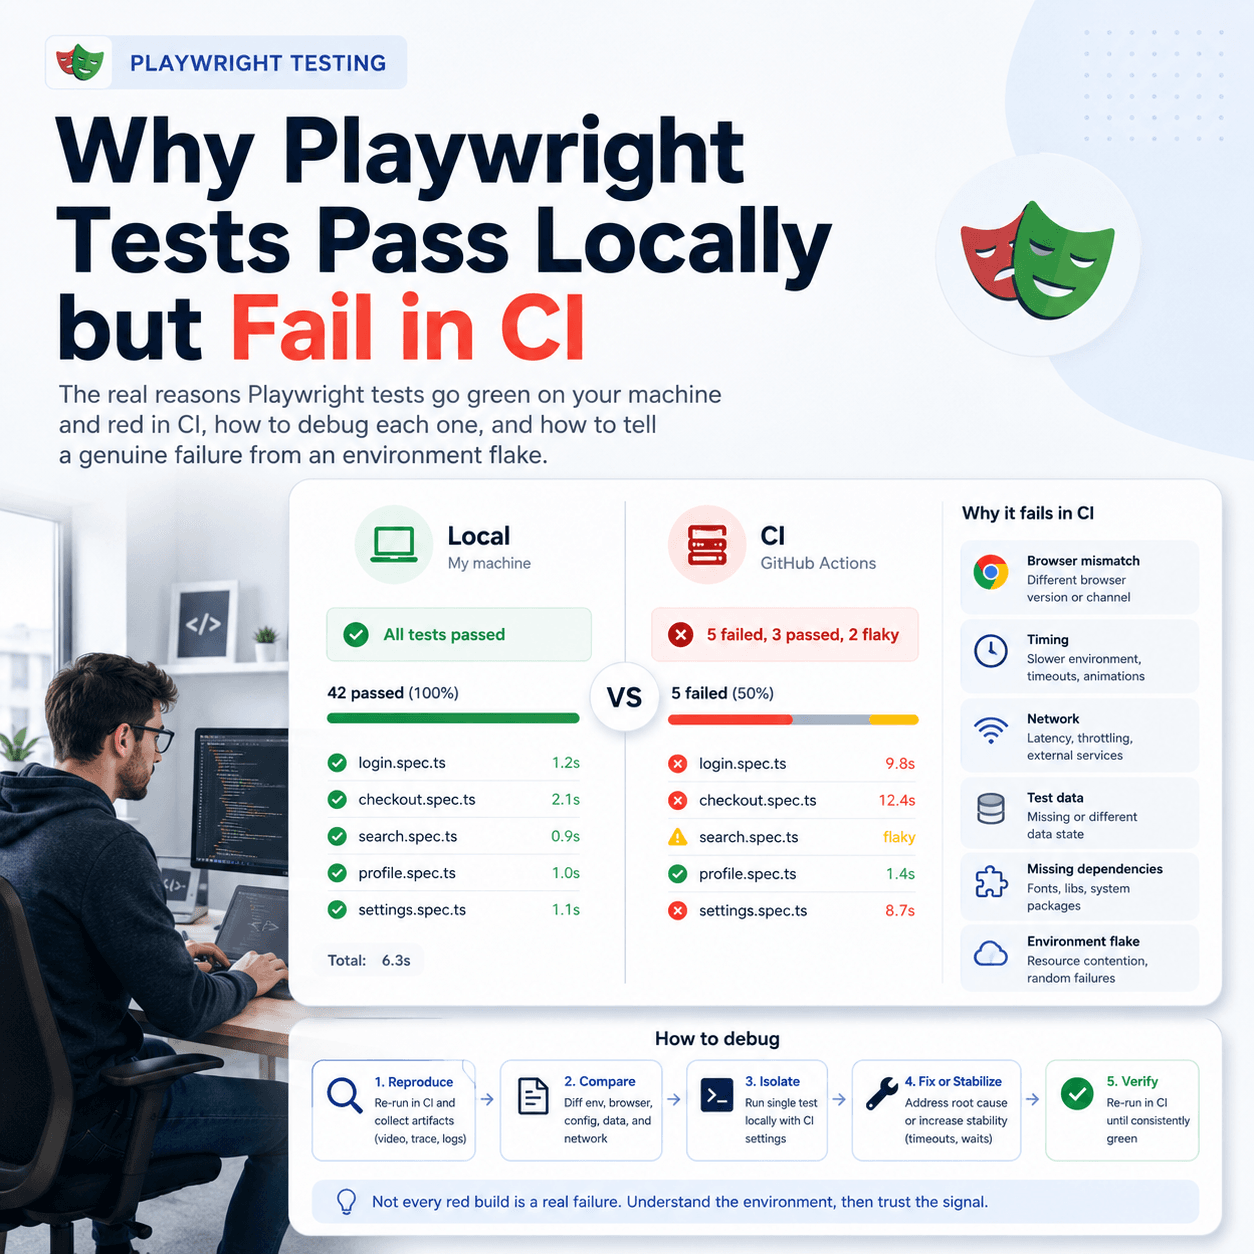
If You're Using Playwright Instead
If your team uses Playwright rather than Cypress, the same reporting gap exists and the setup is equally straightforward. See our post on Playwright test reporting beyond the built-in reporters for the equivalent guide.
The Bigger Picture
Cypress's default reporter is well-designed for what it's meant to do — give developers fast, clear feedback during local development. The gap appears when your team grows, your test suite scales, and CI runs become the primary way tests are executed.
At that point the questions change. It's no longer just "did the tests pass?" It becomes "why did this fail, has it failed before, which tests are unreliable, and is our overall quality improving?" Those questions require persistent storage, trend data, and a shared view your whole team can access.
If you're starting to ask those questions, it's worth setting up proper reporting now. The earlier you start storing results, the more history you have when you need it most.
Full documentation for the Cypress integration is available at tesults.com/docs/cypress.