Diagnosing CI Failures Automatically With an AI Failure Diagnosis API
How to turn a red build into a root cause, a regression list, and a deploy gate without a human reading the logs
Jul 9, 2026
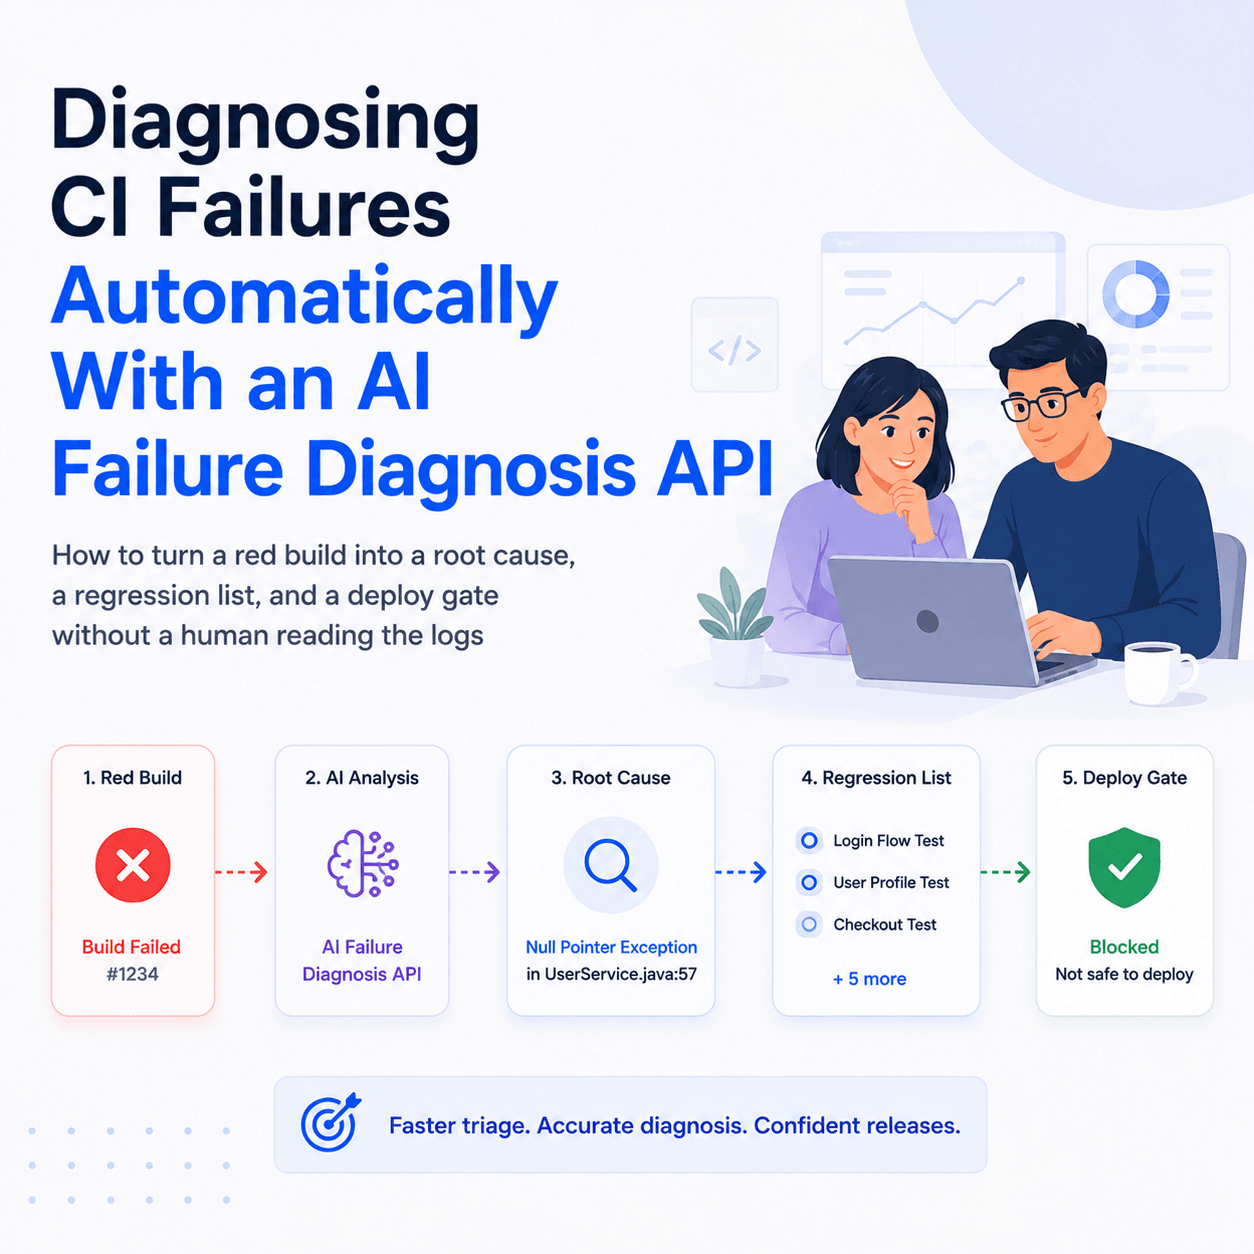
When a CI build goes red, someone has to open the logs and work out what broke, whether it is new, and whether it should block the release. A failure diagnosis API does that step automatically. The Tesults Insights API takes a test run that has already been submitted to Tesults and returns a structured diagnosis: a plain language summary, a root cause, the failure patterns observed, and separately, which tests are newly failing versus which were already broken. Because the response is structured JSON rather than prose, a pipeline can act on it directly, posting a diagnosis as a PR comment, failing a deploy only on genuine regressions, or routing an alert. You call it with a bearer token, a target id, and a run id.
What is an AI failure diagnosis API?
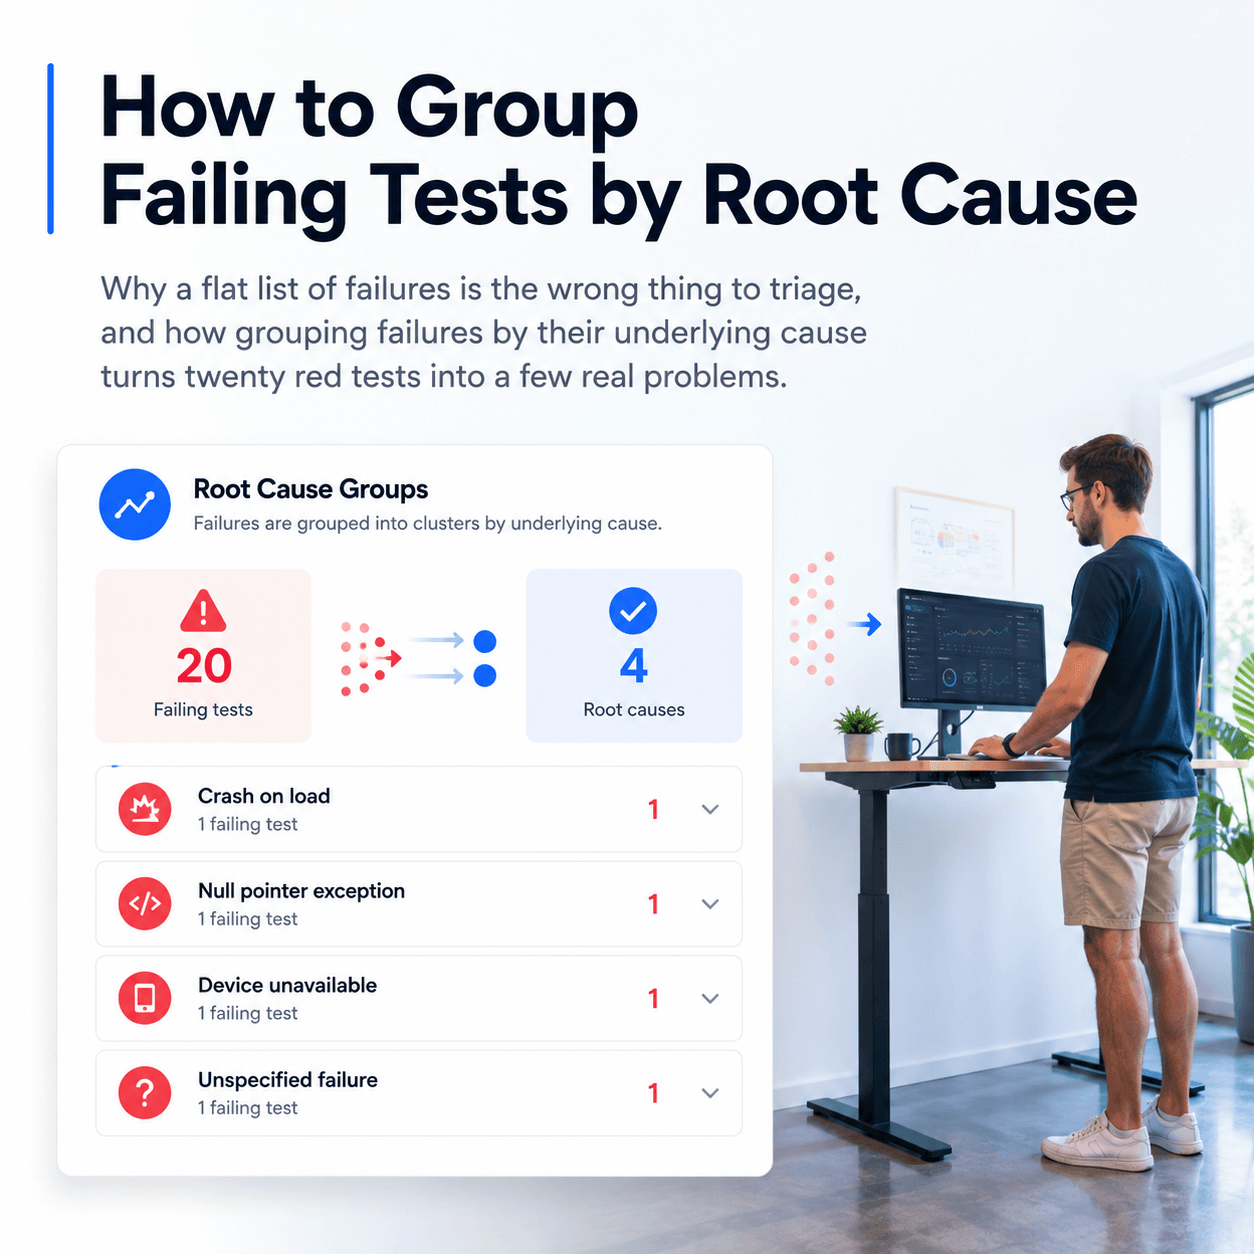
It is an endpoint you call after a test run finishes that answers the questions a human would answer by reading the logs. Not "which tests failed", your test framework already tells you that. The harder questions: what is the common thread across these failures, is this failure new or has it been red for a week, and is anything here actually caused by the change being built.
Answering those requires two things a single CI run does not have. It needs history, the record of what previous runs looked like, and it needs a layer that compares runs and computes differences. The Insights API exposes exactly the cross run intelligence that the Tesults UI shows after a run completes, in a form built for machines. The docs are explicit that responses are structured for direct use in automated pipelines or as input to an LLM without further preprocessing. That is the distinction from scraping your own logs: you are consuming a computed diagnosis, not a text blob you then have to interpret.
What do you need before you can call it?
Three things, and only the first is a setup step.
An API token. Go to the configuration menu in Tesults and click API token under the Tesults API header, then click Create API token. Copy it and keep it secret. This is the bearer token for every request, and it is the same token the Tesults MCP server uses, so if you have already set that up you have one:
-H "Authorization: Bearer token"
A target id. A target is a test job. Fetch the ids for your project from the Targets API:
curl https://www.tesults.com/api/targets \
  -H "Authorization: Bearer token"
A run id. Use the created_time value returned by the Results API for the run you want to diagnose, or take it from the Tesults UI. In a pipeline this is the run you just submitted, and the Results API returns the latest run by default, so one call gets it. Pass cases=false to skip the test case payload when all you want is the id:
curl "https://www.tesults.com/api/results?target=target_id&cases=false" \
  -H "Authorization: Bearer token" \
  | jq '.data.results.runs[0].created_time'
Your tests must already be pushing results to Tesults for any of this to have data to work with. If they are not yet, that is the integration step and it comes first.
How do you get a root cause for a failed build?
Call the explain run endpoint with the target and run:
curl "https://www.tesults.com/api/insights/explain-run?target=target_id&run=run_id" \
  -H "Authorization: Bearer token"
The response contains an insight object with the diagnosis:
{
  "data": {
    "code": 200,
    "message": "Success",
    "insight": {
      "summary": "149 of 150 tests passed. 1 test failed in the Checkout suite.",
      "root_cause": "Payment gateway timeout during order submission.",
      "failed_count": 1,
      "failure_patterns": [
        "Timeout errors concentrated in Checkout suite"
      ]
    }
  }
}
That is the whole diagnosis step. summary and root_cause are what you would put in a Slack message or a PR comment. failed_count and failure_patterns are what you would branch on. Note what the endpoint saved you: nobody had to open a log, scroll to the first stack trace, and notice that every failure in the suite was a timeout.
How do you gate a deploy on real regressions only?
Failing a deploy whenever the build is red is a blunt gate. Most suites carry some number of known failures, and blocking on those trains everyone to override the gate. What you want is to block on failures that are new.
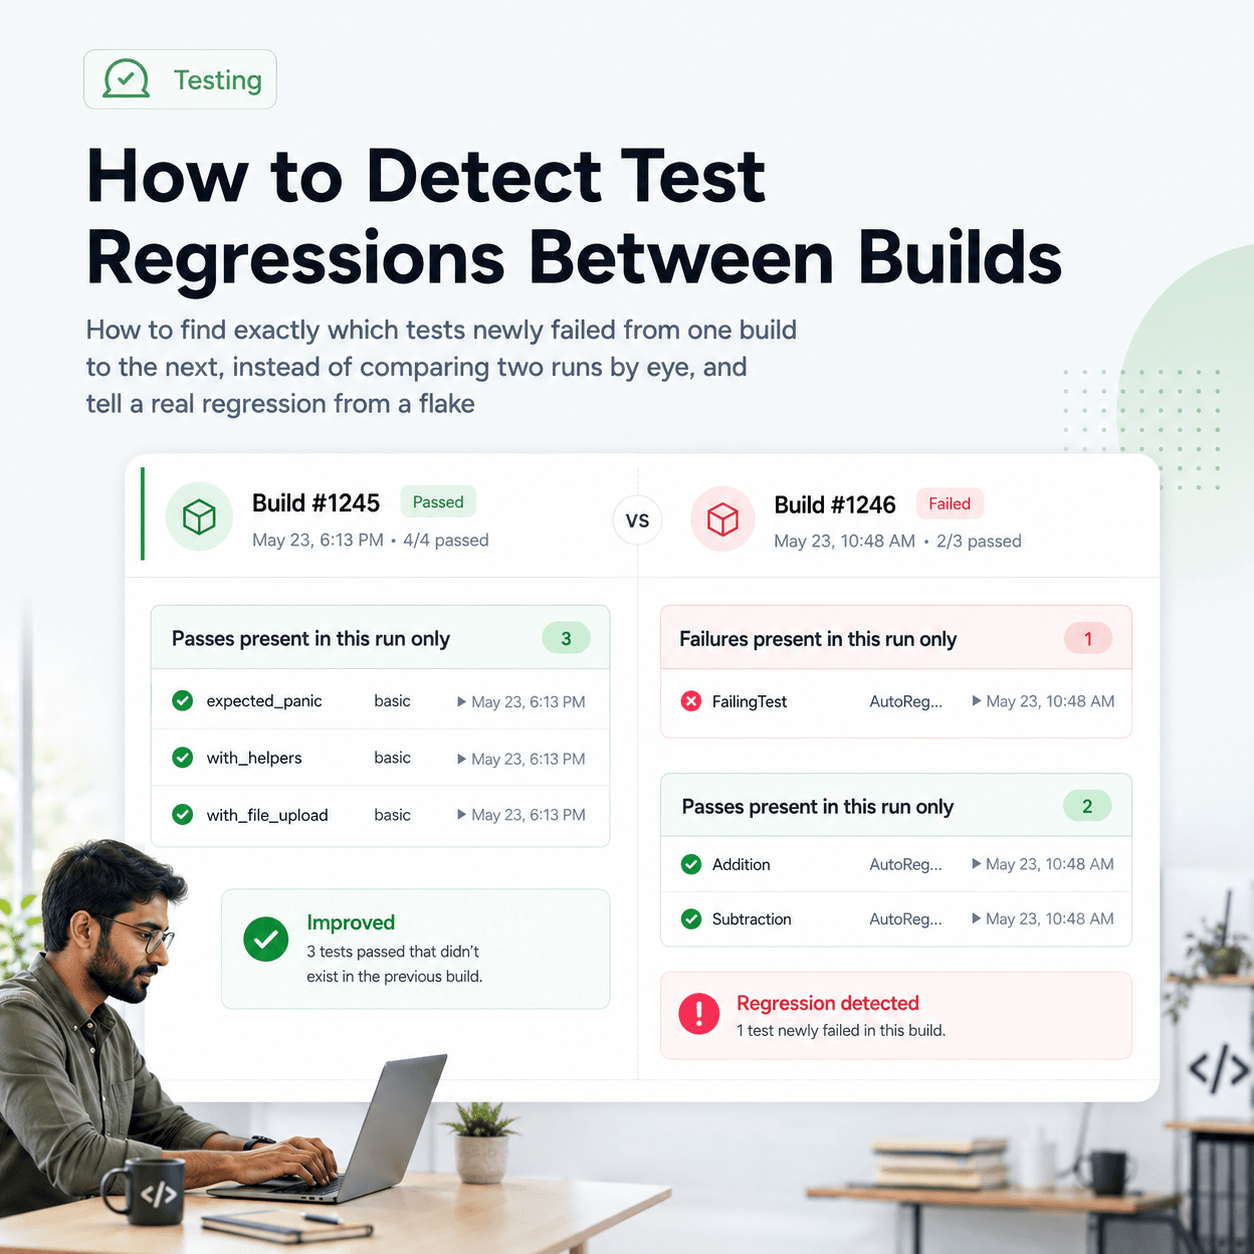
The regressions endpoint does that separation for you. It compares the most recent run against a historical baseline and distinguishes new failures from pre existing ones:
curl "https://www.tesults.com/api/insights/regressions?target=target_id" \
  -H "Authorization: Bearer token"
{
  "data": {
    "code": 200,
    "message": "Success",
    "insight": {
      "new_failures": [
        { "name": "Submit order", "suite": "Checkout", "hash": "7c95f9b7-578d92c19fdd" }
      ],
      "continuing_failures": [],
      "impacted_tests": 1,
      "baseline_comparison": "1 new failure vs previous run (build: 2.4.0).",
      "suspected_change_point": "2.4.1"
    }
  }
}
impacted_tests counts new failures only. That makes the gate a one line condition in your pipeline: block if it is above zero, proceed otherwise, even if continuing_failures is non empty. A minimal shell gate looks like this:
IMPACTED=$(curl -s "https://www.tesults.com/api/insights/regressions?target=$TARGET" \
  -H "Authorization: Bearer $TESULTS_API_TOKEN" \
  | jq '.data.insight.impacted_tests')

if [ "$IMPACTED" -gt 0 ]; then
  echo "Blocking deploy: $IMPACTED new failure(s)."
  exit 1
fi
The suspected_change_point field gives you the build name to name in the alert, which is usually the first thing anyone asks when a gate trips.
How do you post what changed on a pull request?
For PR comments the useful framing is not the absolute state of the suite but the delta. The what changed endpoint compares a run against the previous run for the same target and returns new failures, resolved failures, and continuing failures:
curl "https://www.tesults.com/api/insights/what-changed?target=target_id&run=run_id" \
  -H "Authorization: Bearer token"
{
  "delta_summary": "2 new failures, 1 resolved since the previous run.",
  "new_failures": [
    { "name": "Submit order", "suite": "Checkout", "hash": "7c95f9b7-578d92c19fdd" }
  ],
  "resolved_failures": [
    { "name": "Load homepage", "suite": "Navigation", "hash": "3fa12c01-91ae74b20d11" }
  ],
  "continuing_failures": []
}
The delta_summary string is written for humans and drops straight into a comment body. The arrays are what you use to decide whether to comment at all. A pipeline that posts only when new_failures is non empty is one that reviewers will not learn to ignore.
How do you avoid alerting on flaky tests?
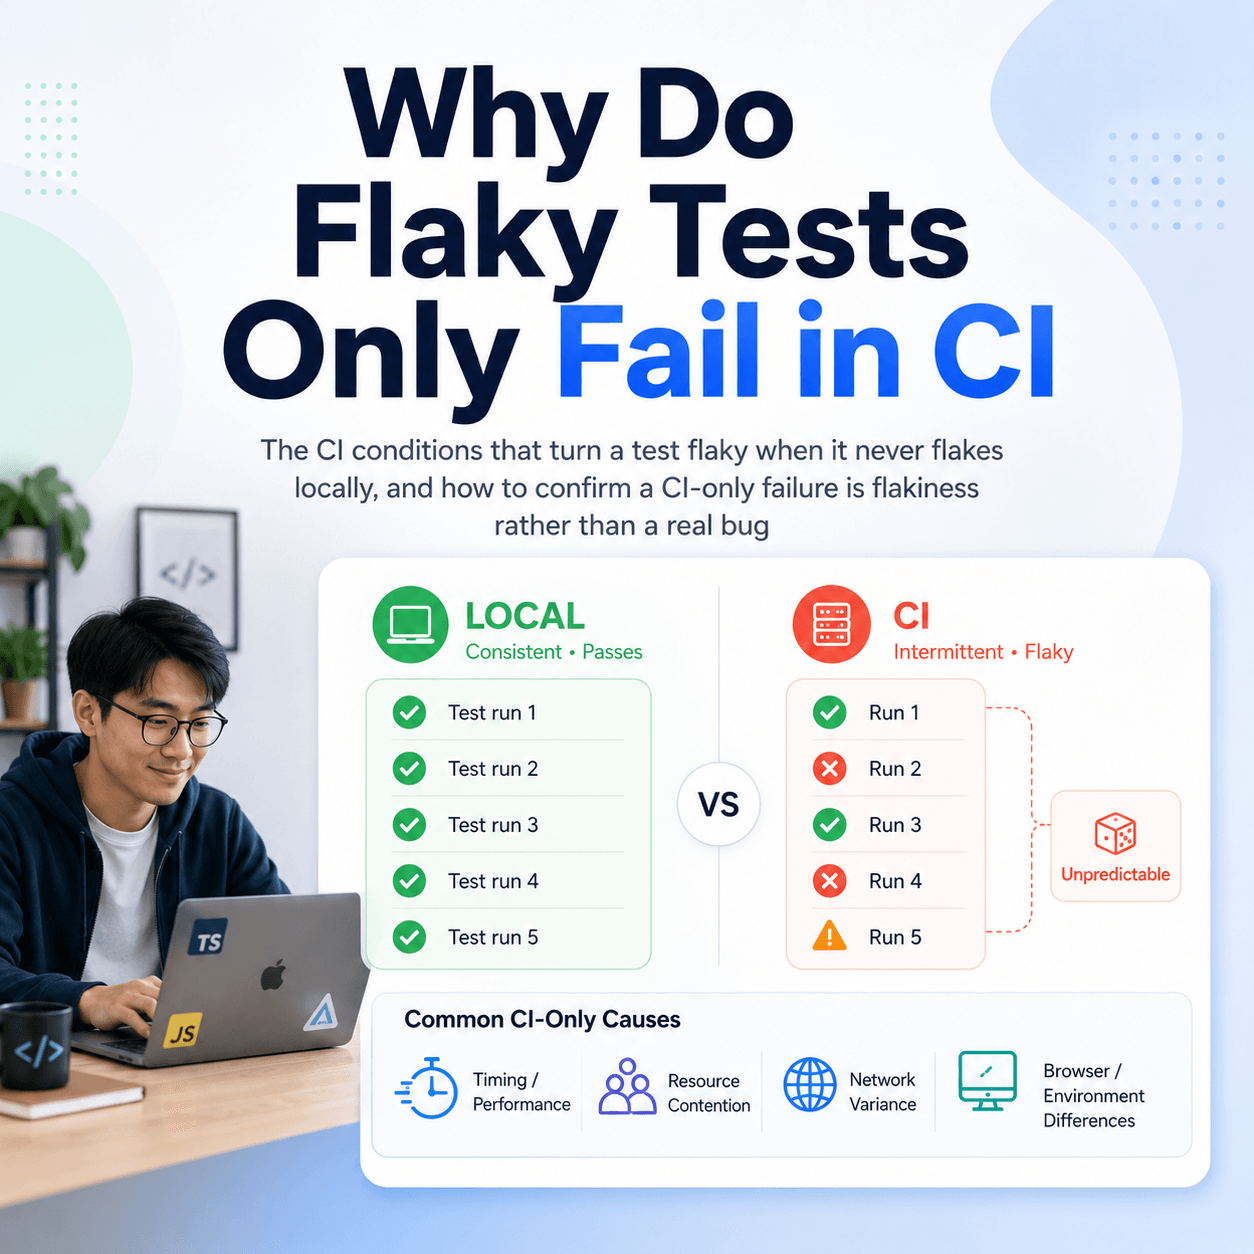
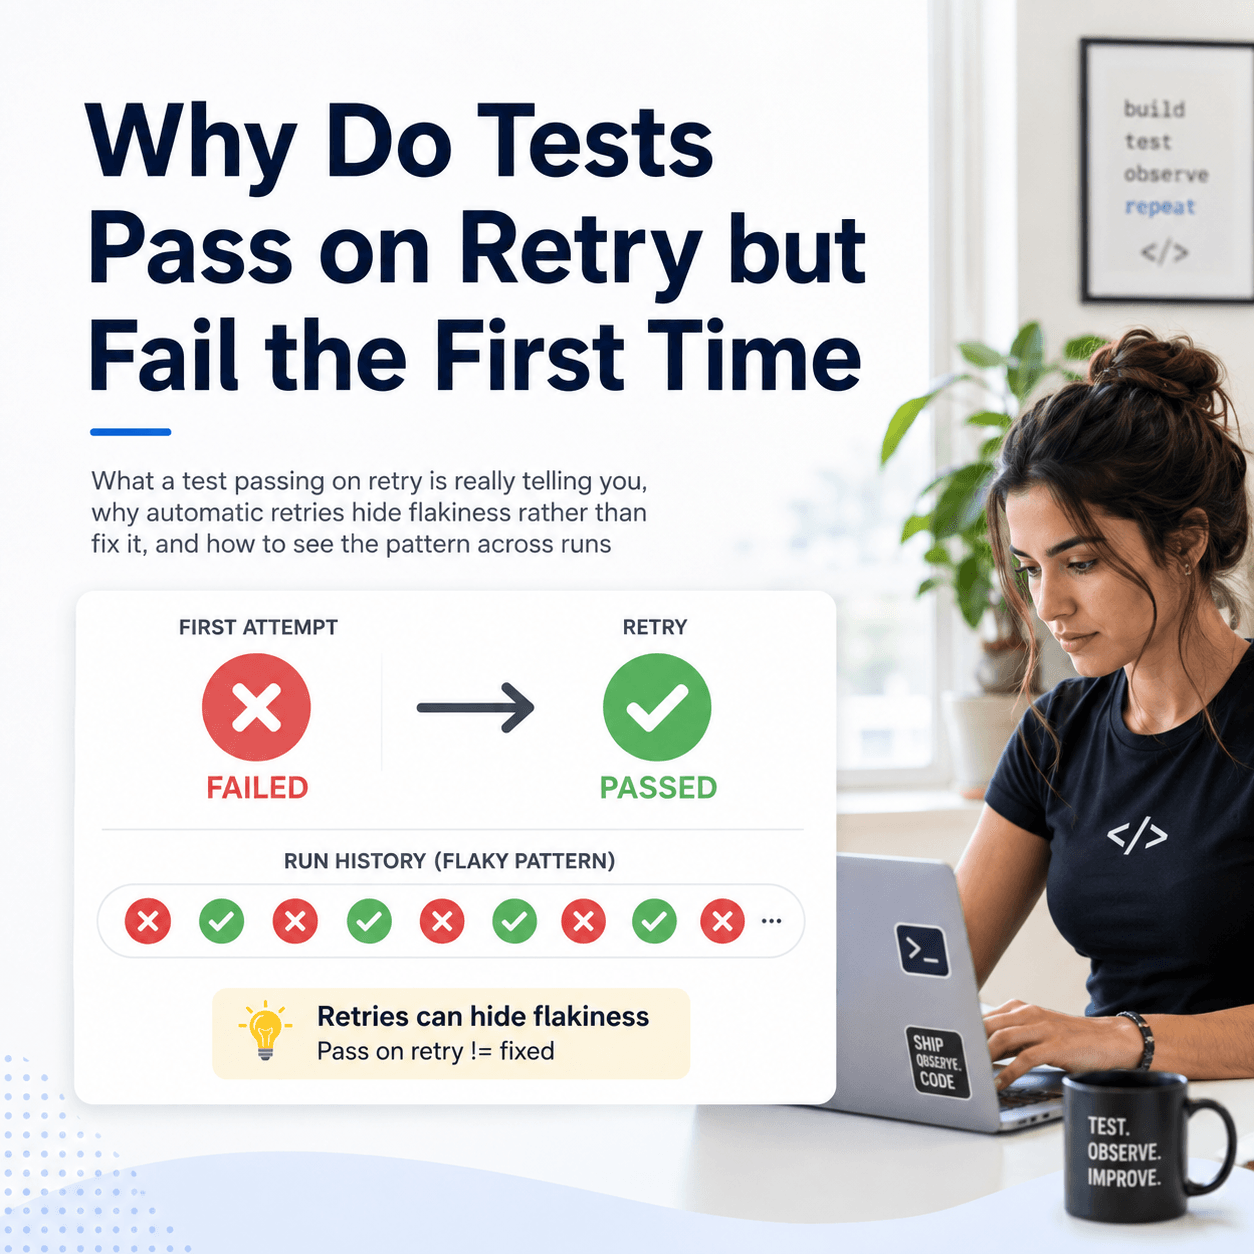
A diagnosis that treats a flaky test as a regression is worse than no diagnosis, because it burns trust in the gate. Before escalating a failure, check whether the test is stable. The flaky tests endpoint returns tests with inconsistent results for a target, each with a failure rate and a classification:
curl "https://www.tesults.com/api/insights/flaky-tests?target=target_id" \
  -H "Authorization: Bearer token"
{
  "flaky_tests": [
    {
      "name": "Submit order",
      "suite": "Checkout",
      "failure_rate": 0.4,
      "last_failure": 1700082800000,
      "classification": "likely flaky"
    }
  ]
}
Optional from and to parameters, both Unix timestamps in milliseconds, constrain the analysis to a time window, which is useful if you only care about behavior since the last release. For a single test, the explain case endpoint takes the test case hash and returns a stability classification, a trend, a confidence score, and the number of runs analysed. If you are already fetching results, you can skip the extra call entirely: set analysis=true on the Results API and a flaky indicator is returned inline with each test case. Cross referencing a new failure against these before paging anyone is what separates a diagnosis pipeline from an alarm that cries wolf.
What is computed and what is generated?
This matters when you are deciding which fields to build automation on. The detection is deterministic and computed from run history, not inferred. A test is classified as flaky when its result alternates between pass and fail more than twice across the runs analysed. Regressions come from comparing the latest run to a baseline and splitting genuinely new failures from continuing ones. Case stability is computed over up to the last ten runs the case appeared in, and returned with an explicit confidence_score and runs_analyzed count so you can see how much evidence sits behind it.
The plain language fields, summary, root_cause, delta_summary, baseline_comparison, and the recommendations array, are the layer written on top of those computed results. They are excellent for the message a human reads. They are not what you should branch on. Gate your pipeline on impacted_tests, on the length of new_failures, on classification and failure_rate. Put root_cause in the notification body. Keeping that line clear is what makes an automated diagnosis trustworthy rather than a plausible sentence your deploy pipeline is obeying.
What does the full pipeline look like?
Assembled, the flow after your tests run is short. Submit results to Tesults through your framework integration. Call regressions and read impacted_tests to decide whether to block. If it is above zero, call explain run for a root cause and cross reference the new failures against flaky tests before escalating. Post delta_summary and root_cause to the PR or the channel. No human reads a log unless the gate actually trips.
When it does trip, send the person somewhere better than a log. Each run in the Results API response carries a run_url, so include it in the same notification as the root cause. Whoever picks the alert up lands on the run itself, with the failing cases, their history across previous runs, and any screenshots or logs attached to them, rather than scrolling a CI console to reconstruct what the diagnosis already told them. The automation decides whether a human is needed. The run view is what that human should open when the answer is yes.
The value here is not that a model can describe a failure. It is that the questions worth automating, is this new, is this real, what is the common cause, all depend on run history that a single CI job does not have, and the API hands you the computed answers in a form a pipeline can branch on. Every endpoint, parameter, and response shape is documented in the Tesults Insights API documentation, with token setup covered in the authentication documentation.