Dashboard
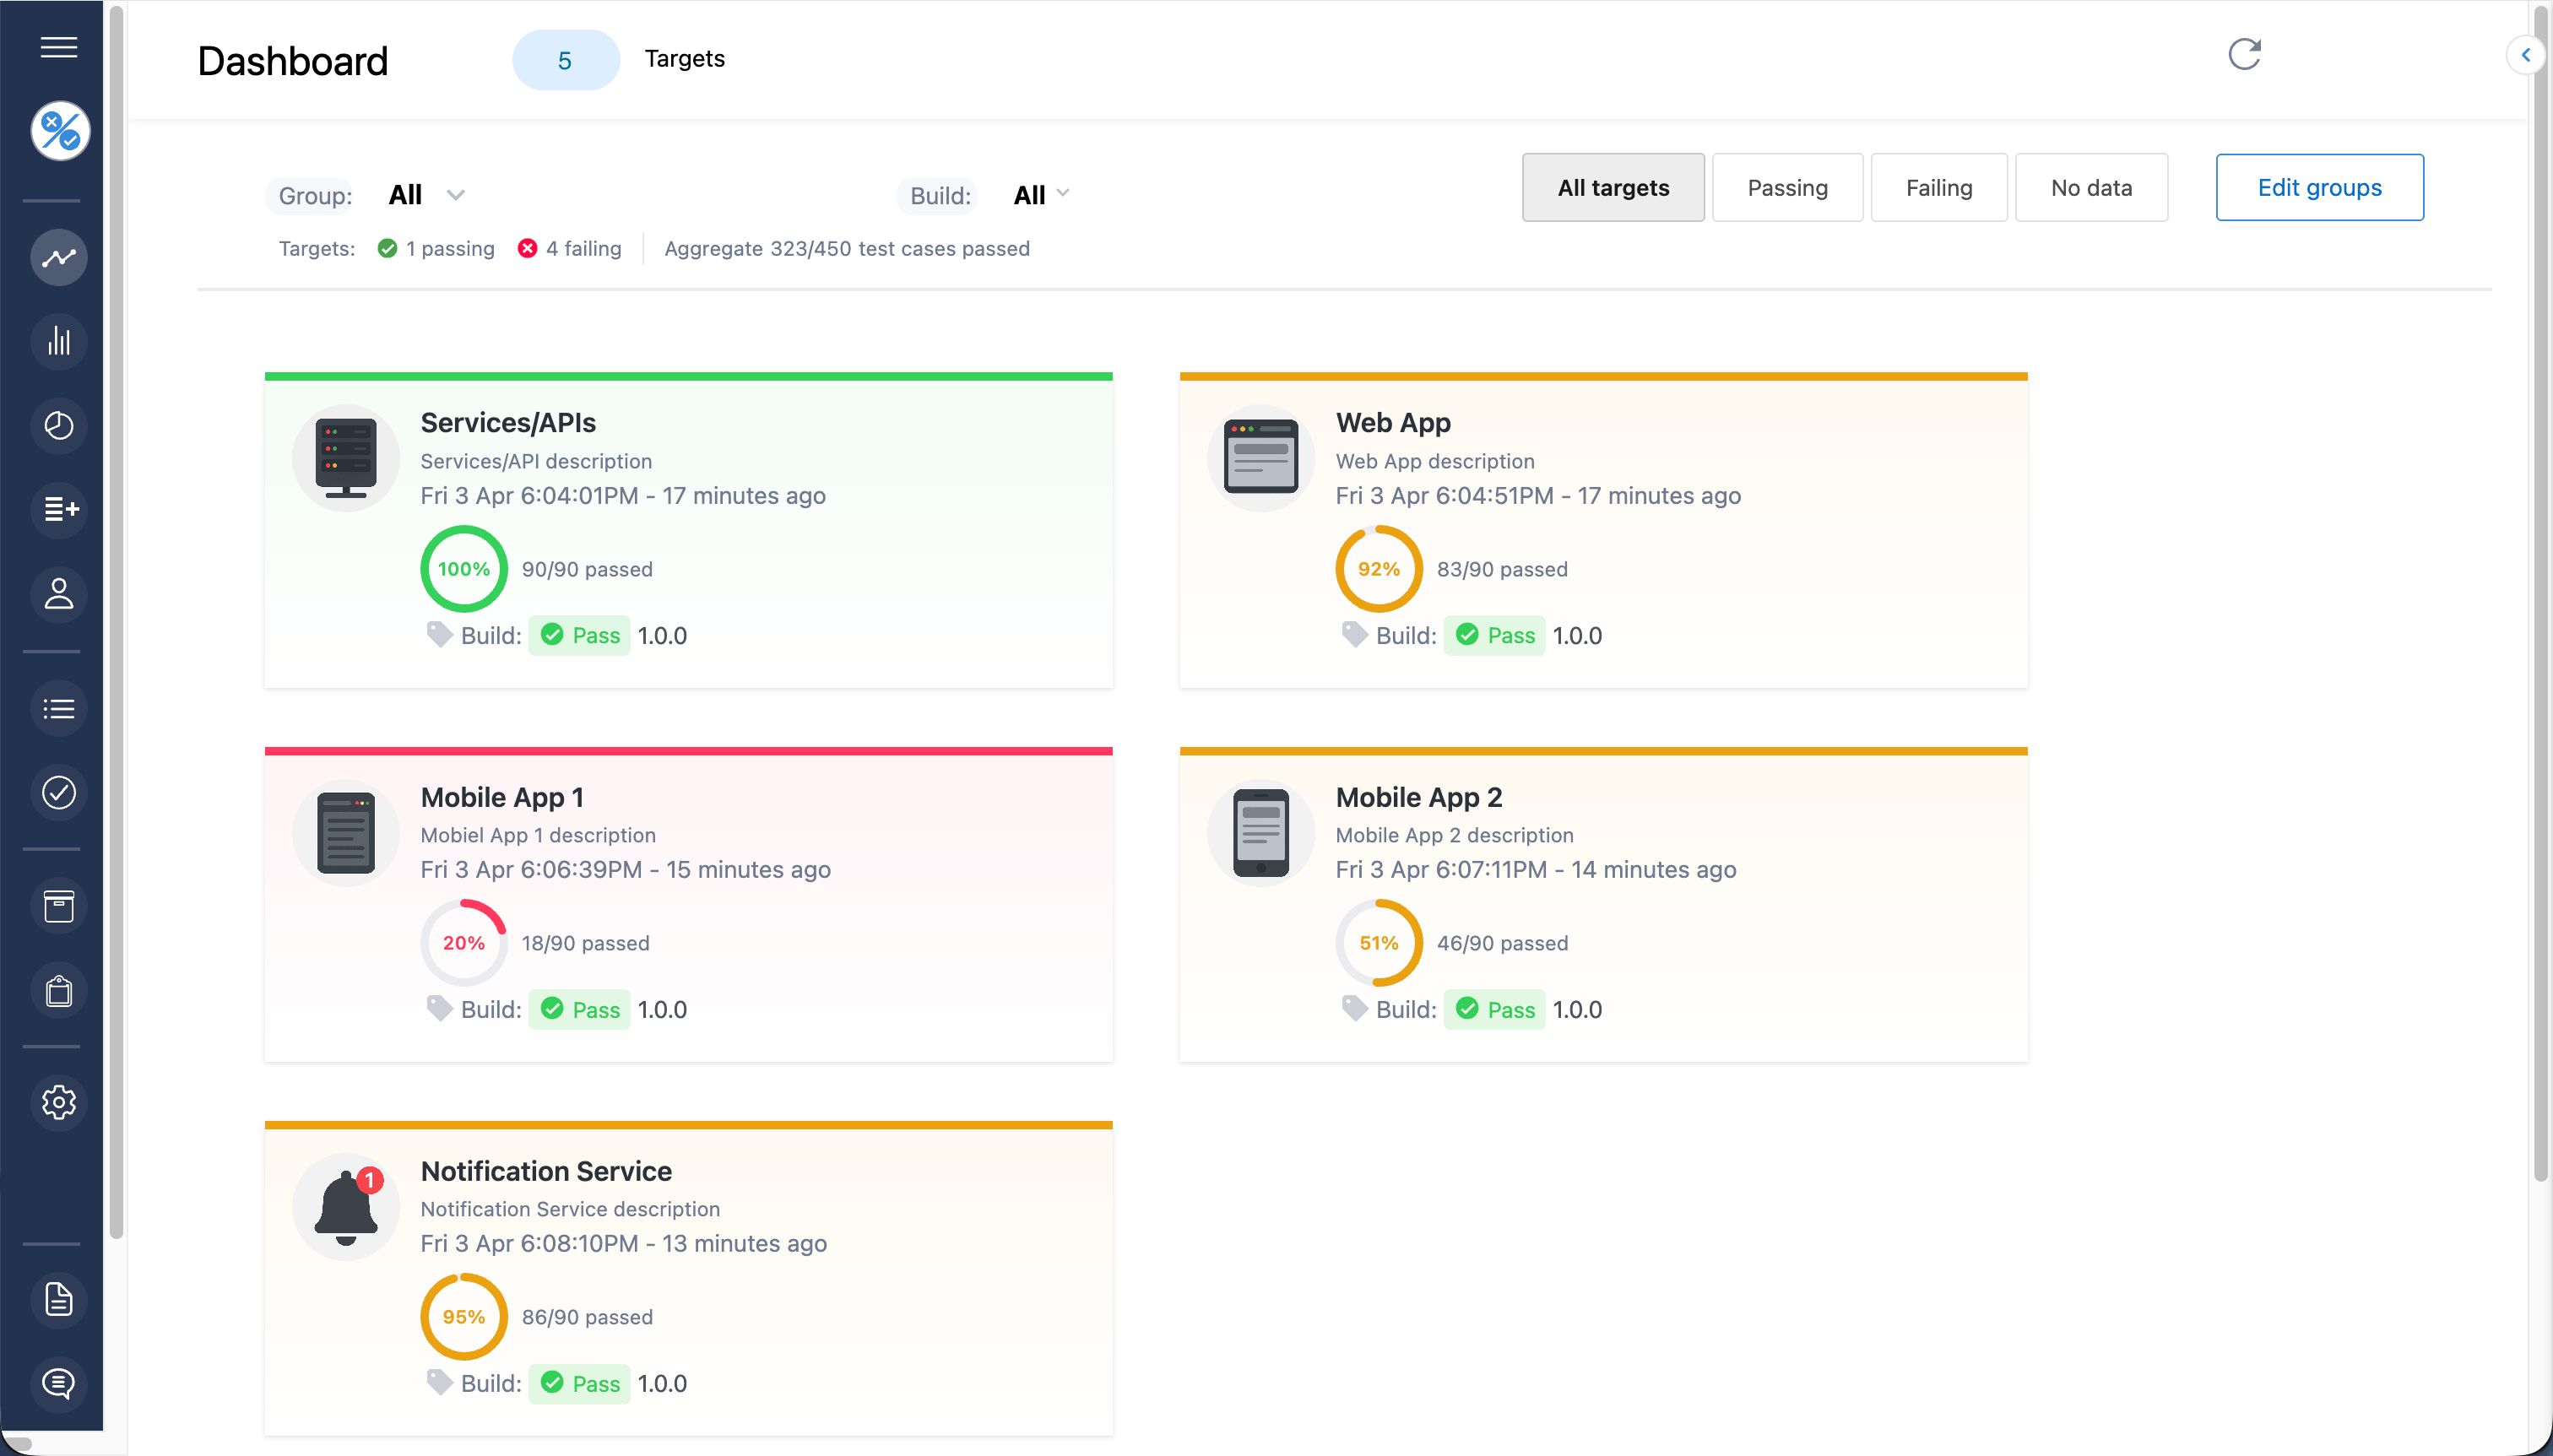
Click Dashboard from the menu to view the project dashboard.
The dashboard view provides a high-level status of an entire project. The dashboard displays the latest results of all of the targets (test jobs) in a project. Get a quick look at whether the pass rate has improved or deteriorated for each target and click on a target (test job) to drill down to the results view for more detailed analysis.
Customizing the dashboard
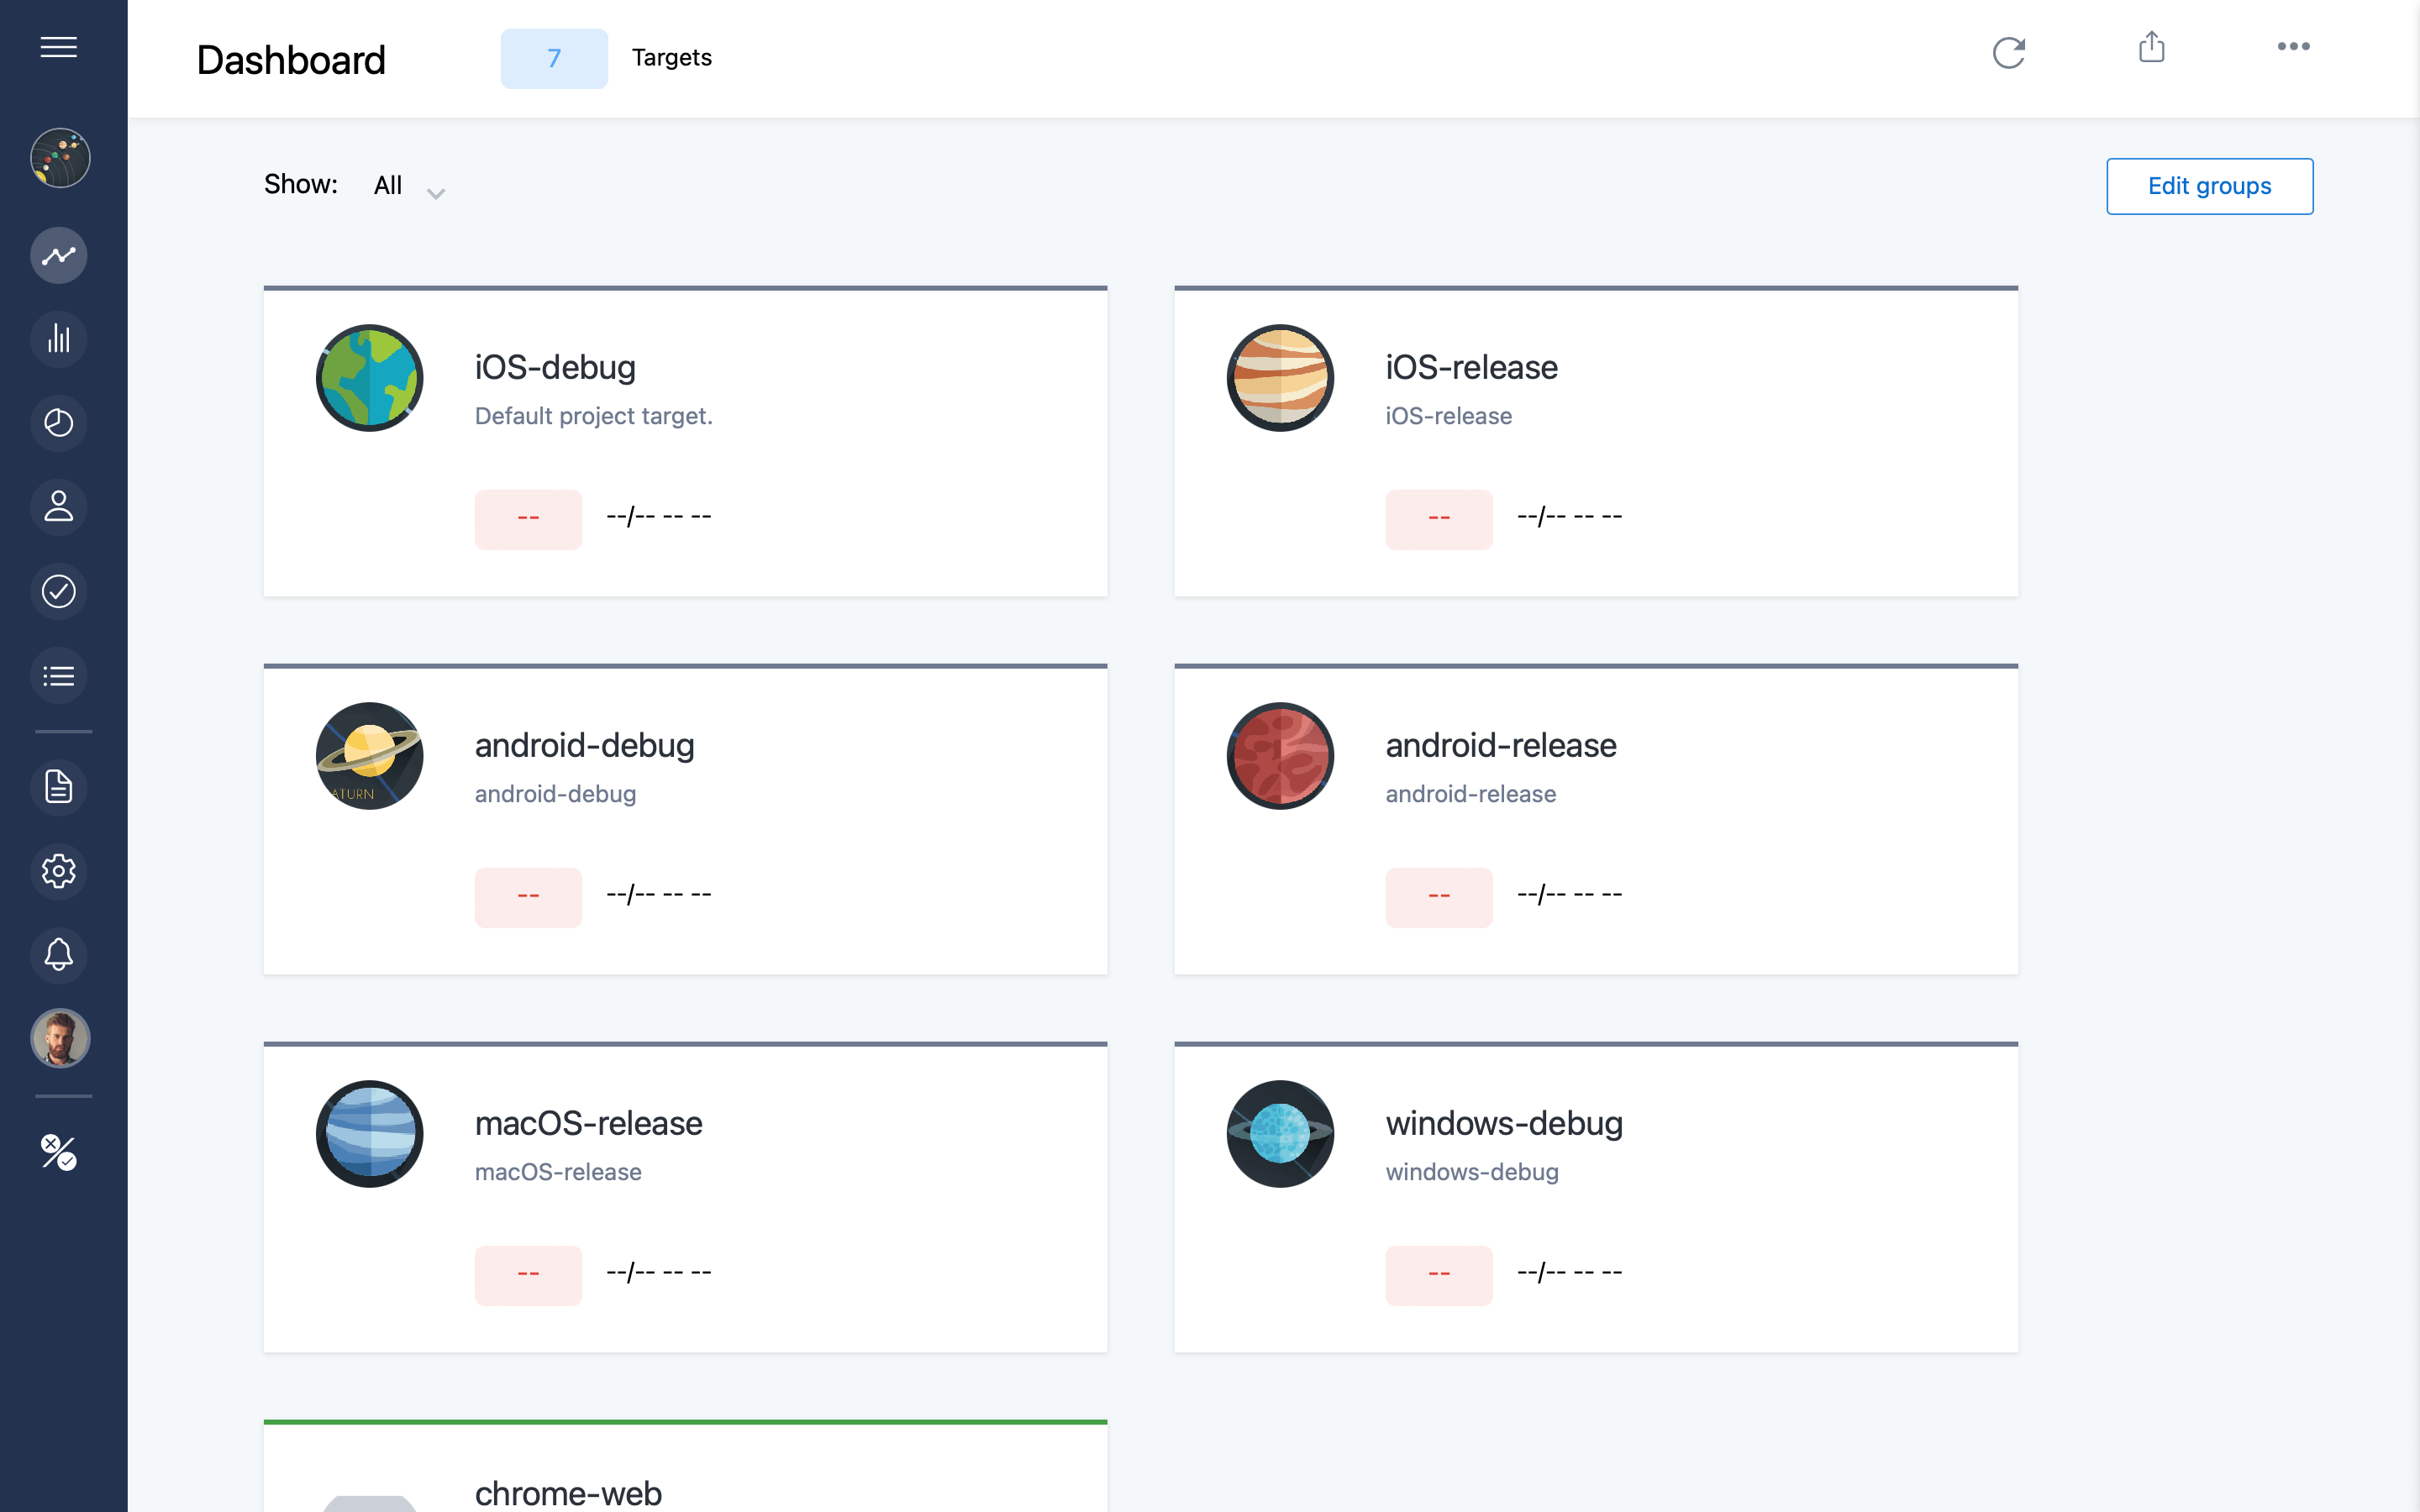
By default the dashboard displays all the targets in a project. If you have a large number of targets, you may find it useful to group targets.
Click the 'Edit groups' button to begin setting up groups.
Add a group name to each target you want to be grouped together. After adding a group (or multiple groups) to a target be sure to click save for each target.
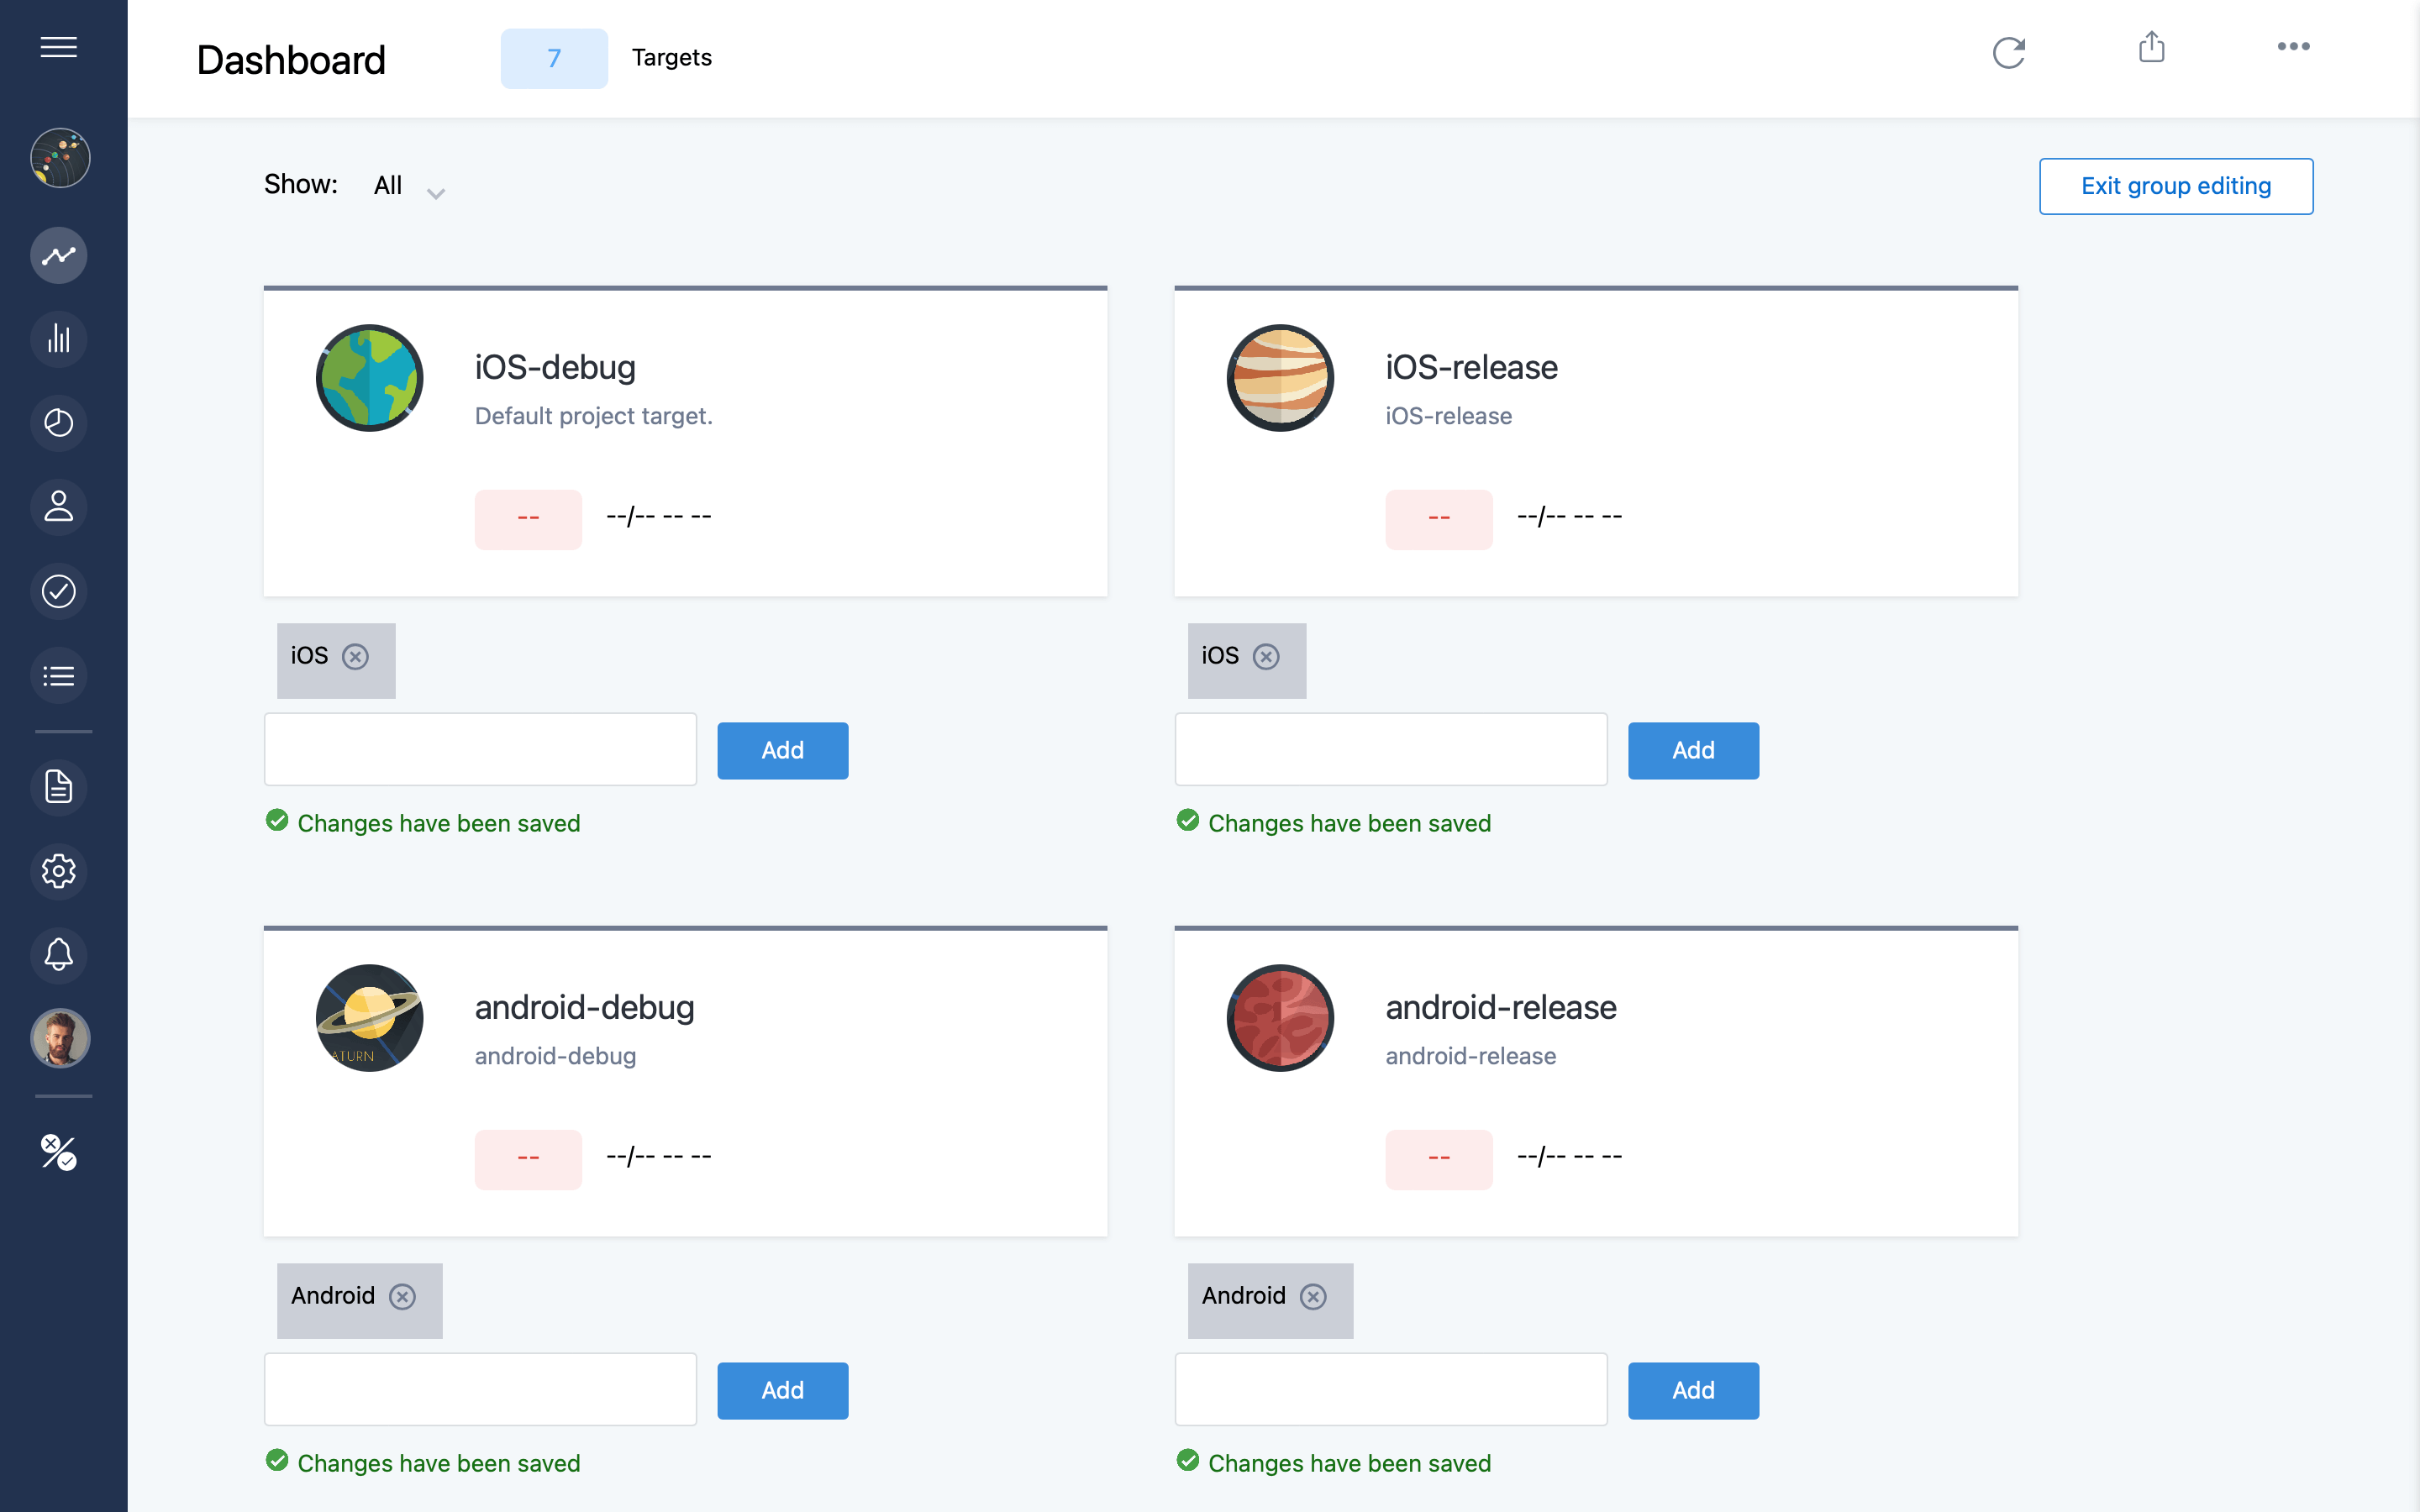
At this point you can click 'Exit group editing' and your groups are now setup. As an example, the groups 'iOS' and 'Android' have been applied in this example and now these groups appear in the dropdown list on the dashboard.
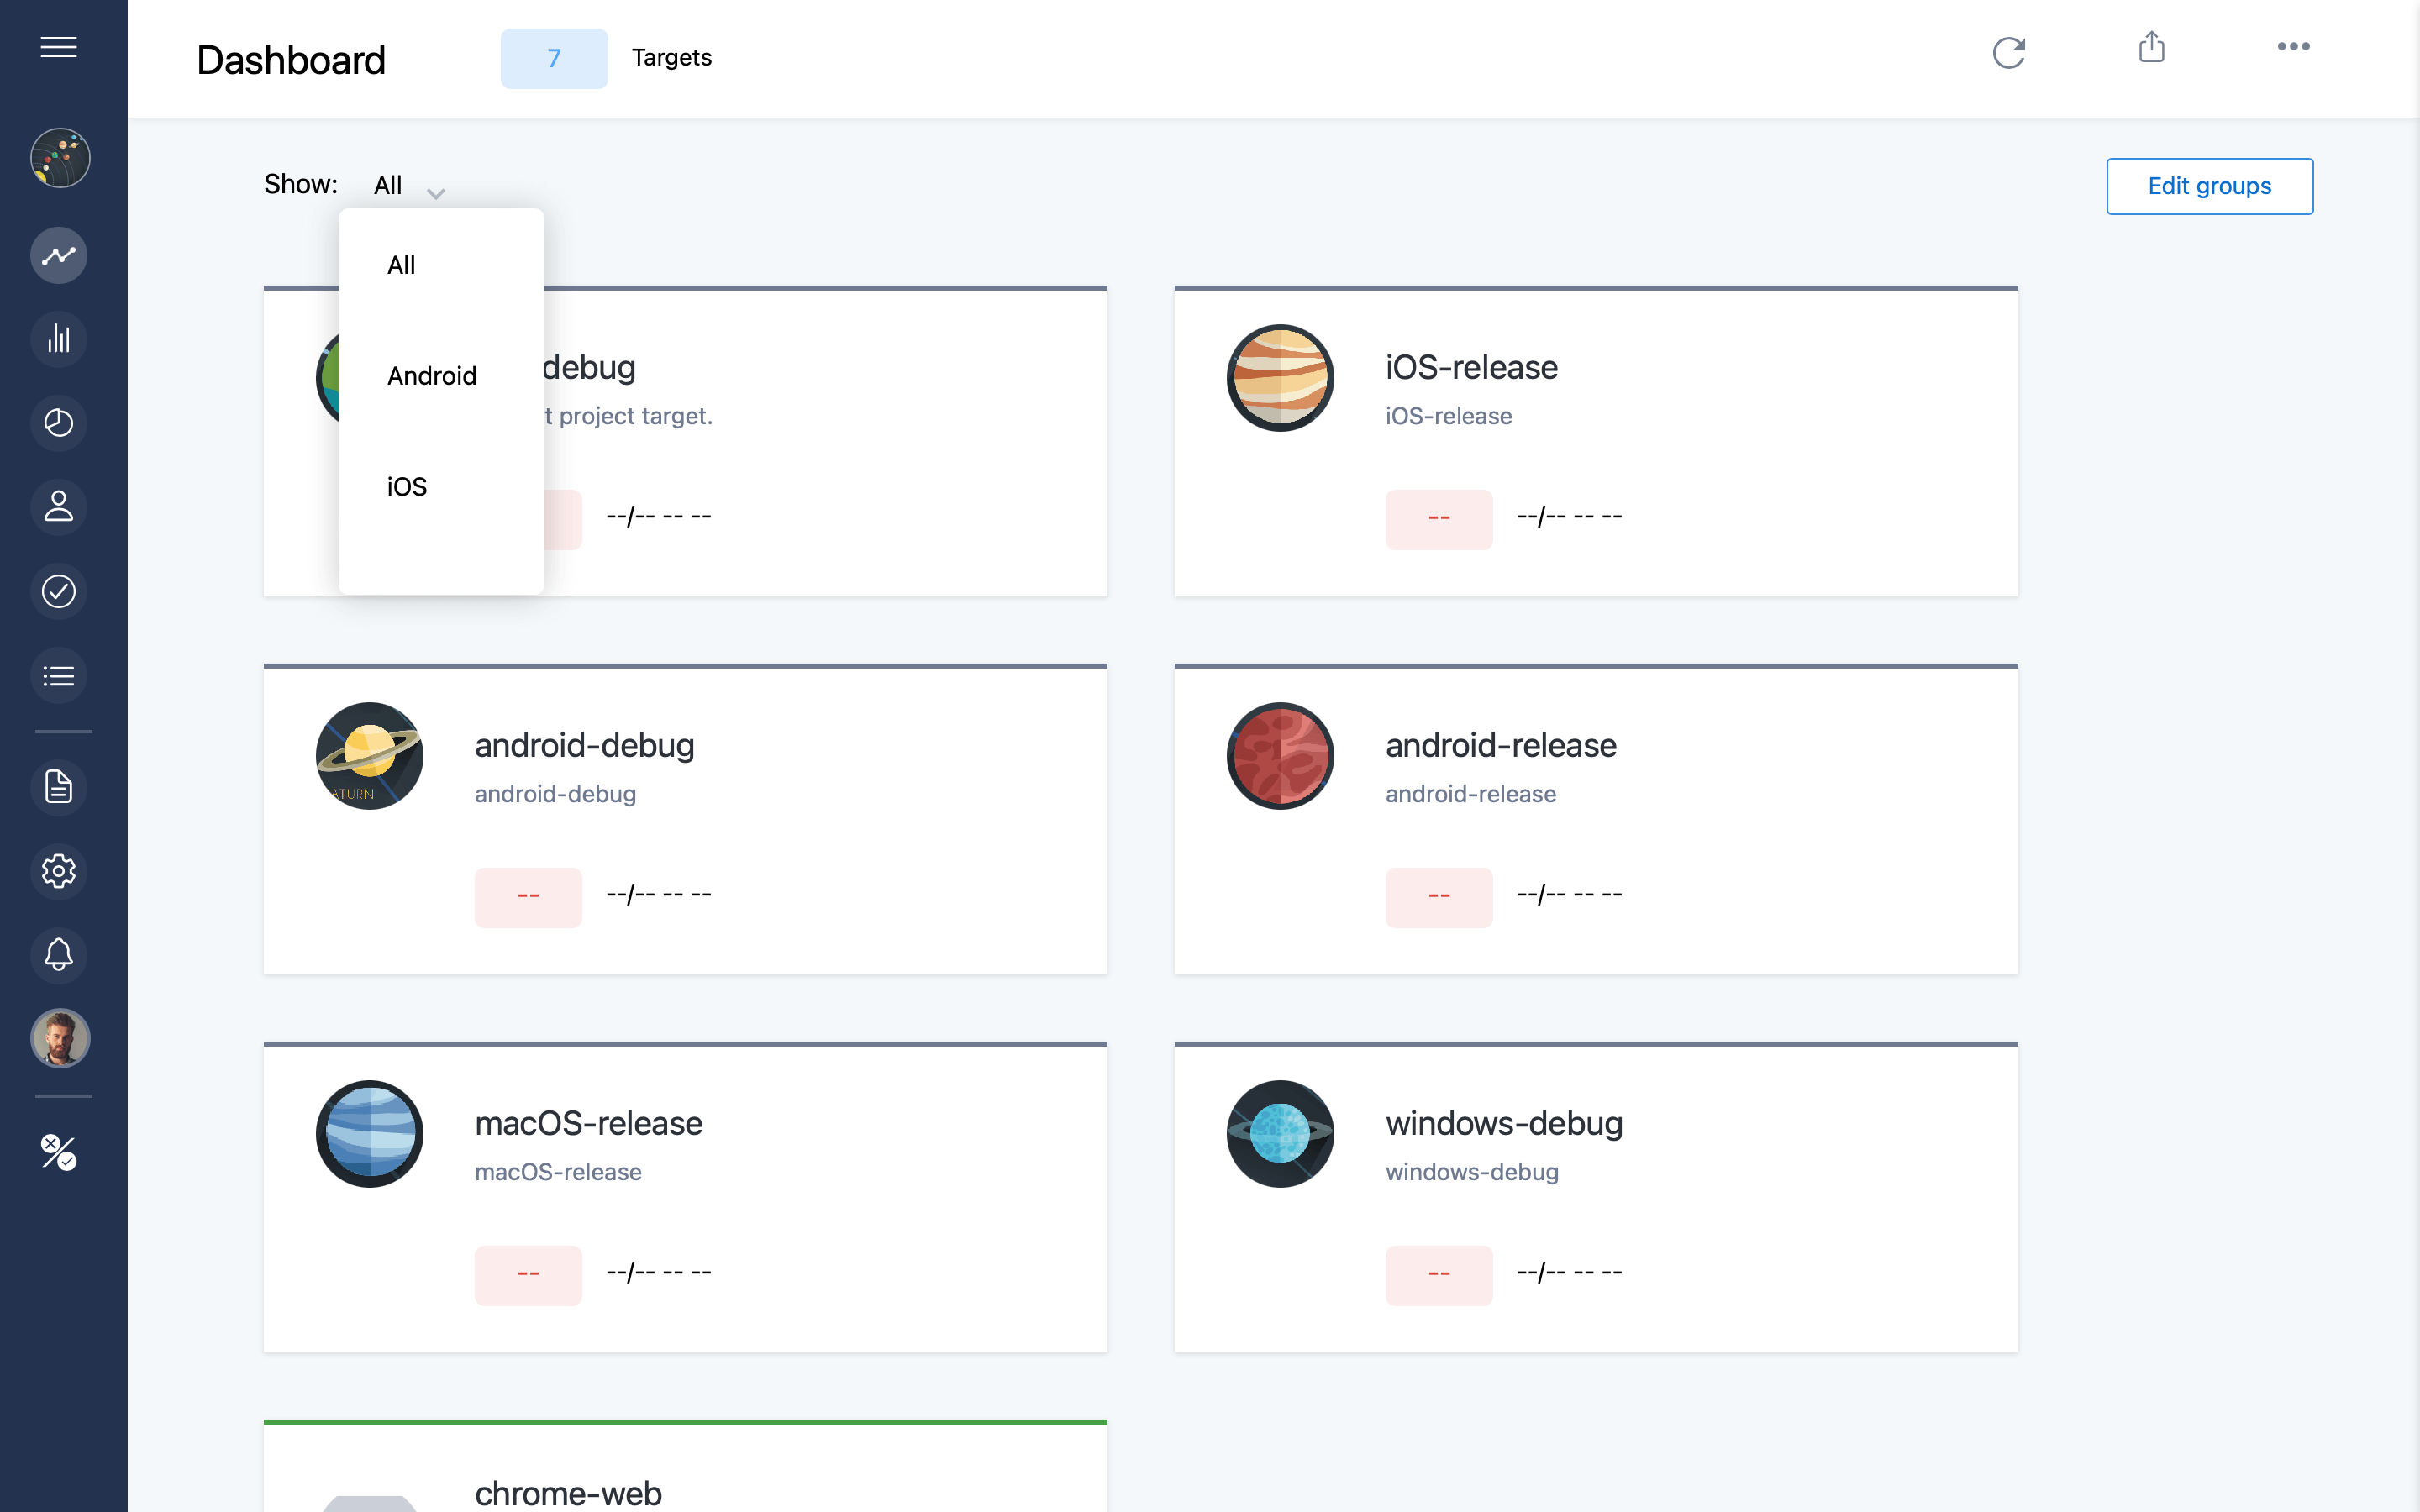
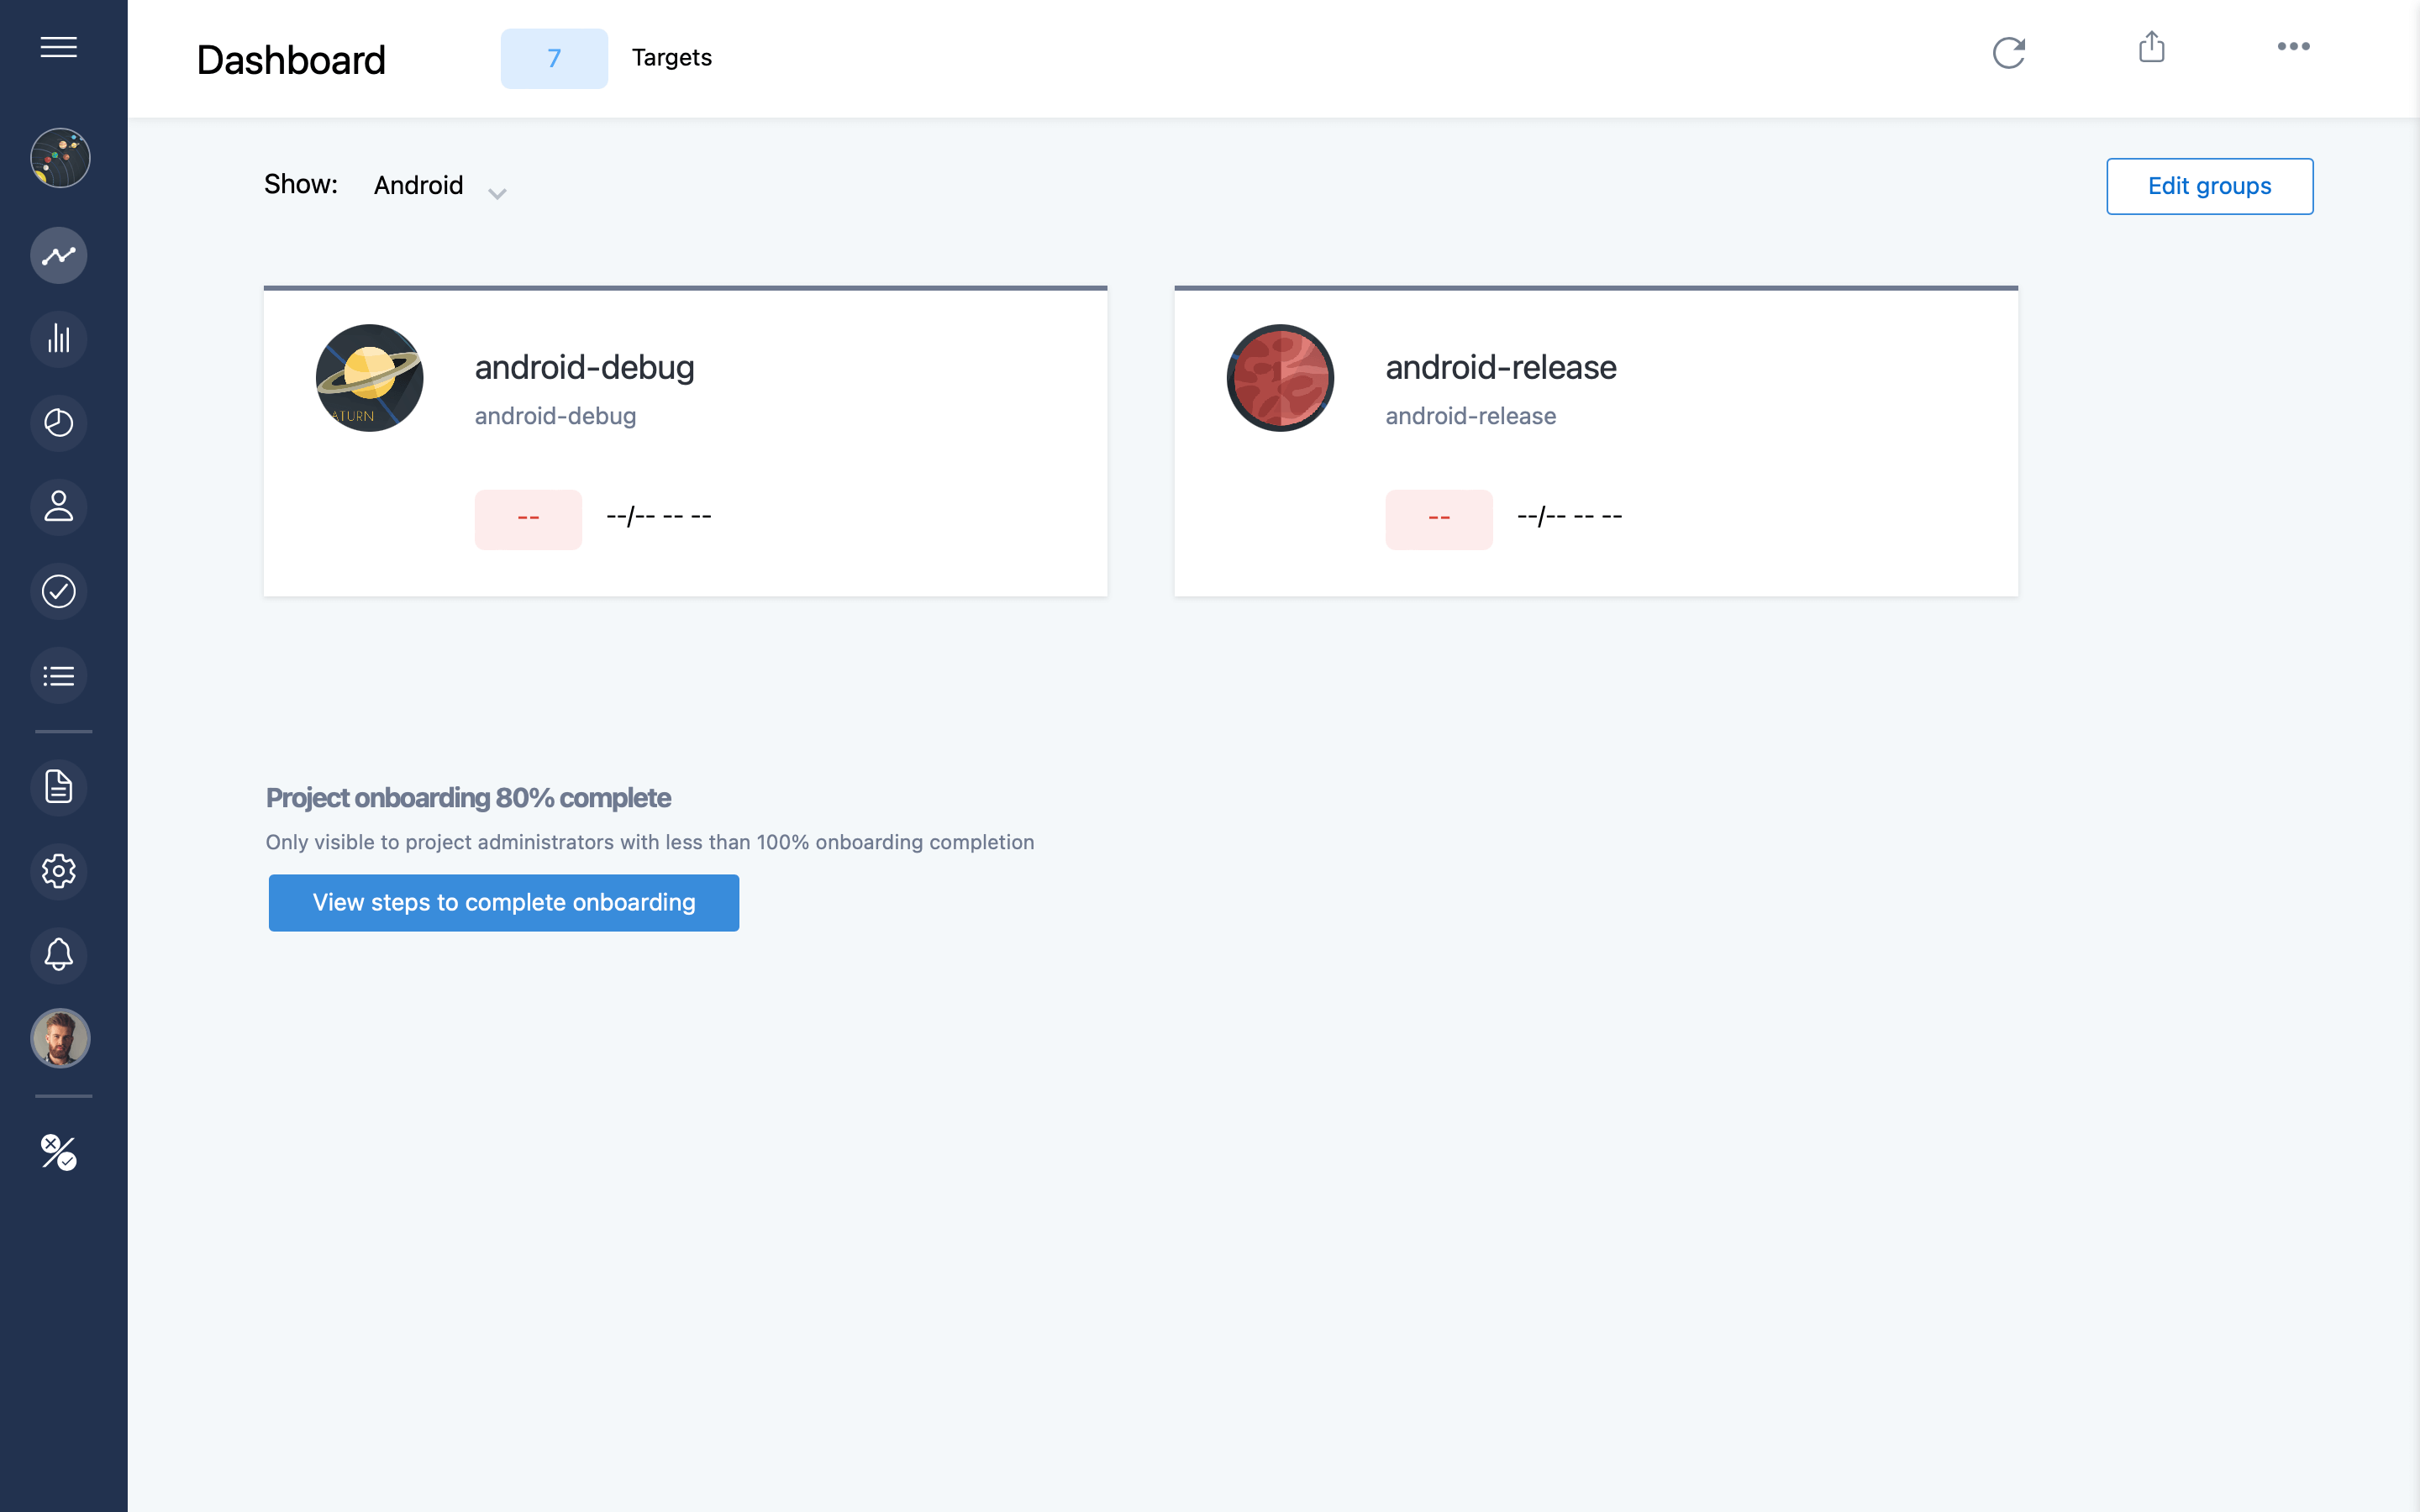
Selecting Android now displays the Android tagged targets (test jobs) only.
You can share links to custom grouped dashboards with your team members. You can group targets in multiple verticals at the same time which is powerful for multi disciplinary sub teams or squads. For example it may make sense for the iOS-debug target to show up in both an 'iOS' group and a 'Debug' group. With the dashboard that's easily accomplished.