How to Report Cypress Test Results to a Dashboard
Send Cypress results somewhere durable and team-visible using the Cypress Module API, with screenshots and videos attached and runs consolidated across CI
Aug 3, 2026 · Updated: Aug 9, 2026
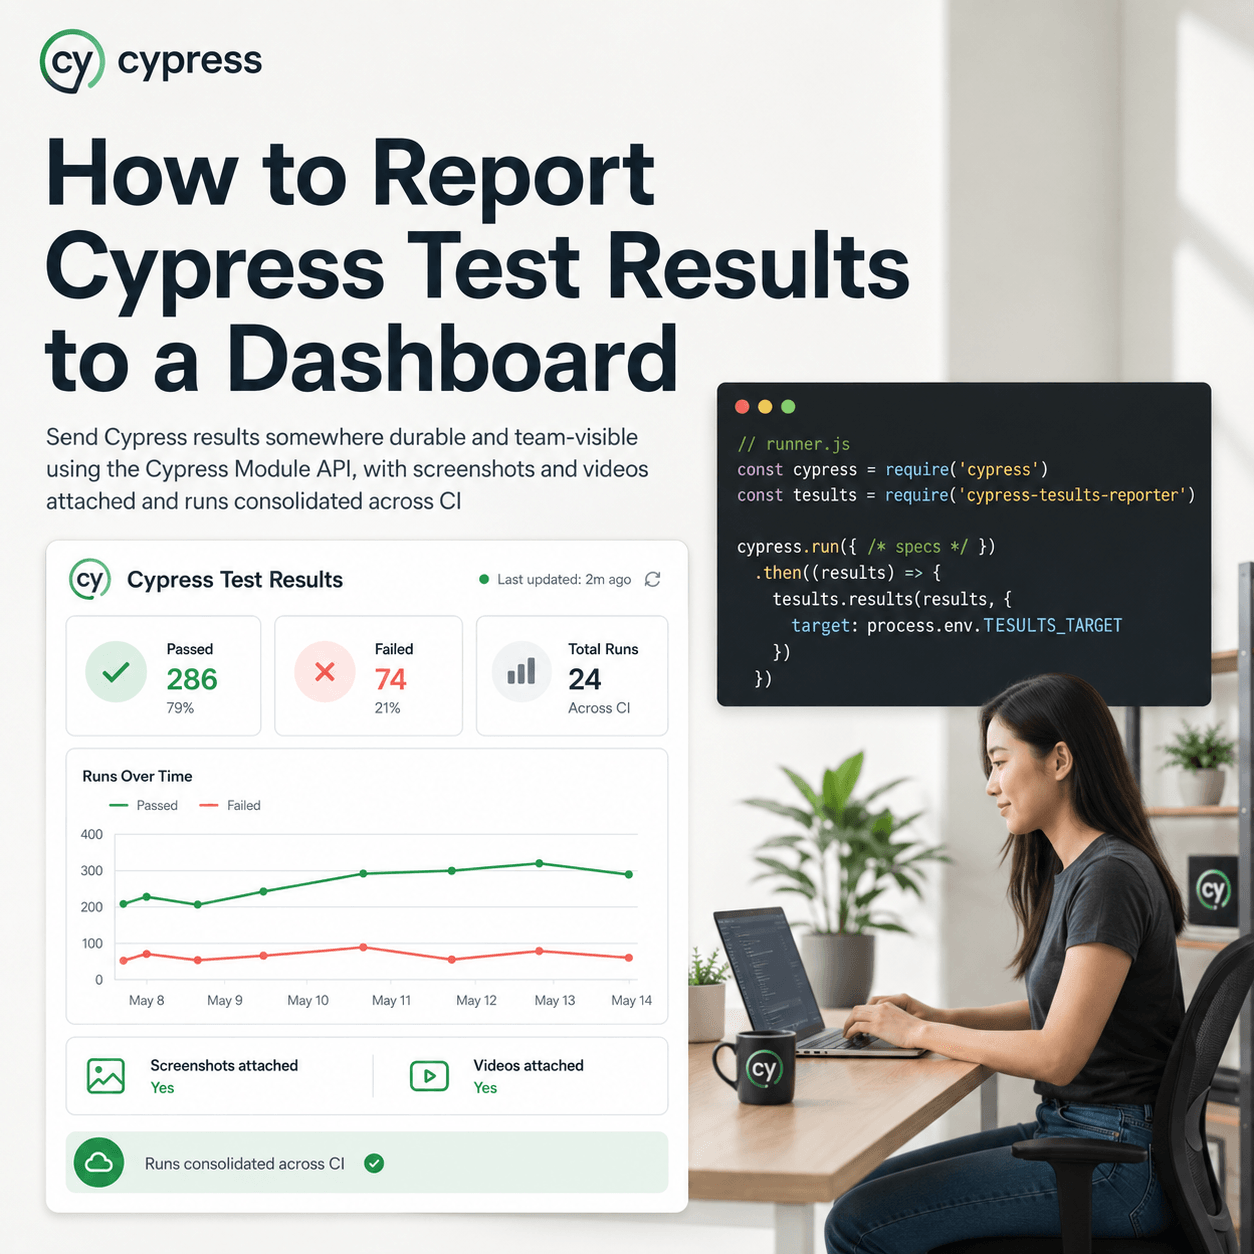
Cypress gives you a good local runner, but its results live and die with the run, so once a team has more than one Cypress suite or more than one person who needs to see results, the terminal and the local run output stop being enough. To report Cypress results to a dashboard, use the Cypress Tesults Reporter, which hooks into the Cypress Module API rather than a plain reporter option, so each run pushes its results to Tesults where they are retained across runs, viewable by the team, and with screenshots and videos attached automatically. The setup is slightly different from other frameworks because of how Cypress runs, so this post covers the Module API approach, the screenshot and video handling, and consolidating parallel CI runs.
Why is Cypress set up differently from other frameworks?
Most test frameworks let you register a reporter by name in a config file. Cypress is built on Mocha, so in theory a Mocha reporter works, but in practice it does not reliably: known Cypress issues mean a Mocha reporter only works if all your tests are in a single spec file, and the Mocha process can exit early before results finish uploading. Most teams split tests across many spec files, so that route is fragile.
The reliable approach uses the Cypress Module API instead. Rather than registering a reporter and running cypress run directly, you run Cypress from a small runner script that starts the tests programmatically and hands the results to Tesults once they complete. This sidesteps the Mocha issues entirely and is the recommended method. It is a little more setup than a one line reporter entry, but it is the setup that actually works for a real multi-file Cypress suite.
How do you add the reporter?
Install it:
npm install cypress-tesults-reporter --save
Create a runner file that starts Cypress through the Module API and passes the results to Tesults. Call it runner.js:
const cypress = require('cypress')
const tesults = require('cypress-tesults-reporter');

cypress.run({
  // specs to run here
})
.then((results) => {
  const args = {
    target: 'token',
  }
  tesults.results(results, args);
})
.catch((err) => {
  console.error(err)
})
Replace token with your Tesults target token, available from the configuration menu within Tesults. Then run the file instead of running Cypress directly:
node runner.js
When the tests complete, the results are pushed to Tesults. That is the whole basic setup. In CI you would read the token from an environment variable set as a secret rather than committing it, and run node runner.js as your test step.
How do you get screenshots and videos from a failure?
This is where Cypress and a dashboard pair well, because Cypress captures rich artifacts and you want them attached to the failing test rather than left on the CI runner. Any screenshots and videos taken using Cypress's built in functions are saved to Tesults automatically, with no extra configuration. A failing test in the dashboard carries its own screenshot and video, which is exactly what you need to diagnose a CI failure you did not watch happen.
If you save files without Cypress's built in functions, custom files can be uploaded too. Save them to a local temporary directory using a suite and test folder structure, and pass the top level directory path in the args alongside the target token:
const args = {
  target: 'eyJ0eXAi...',
  files: '/Users/admin/temporary'
}
At the end of the run, files placed under that directory in a per suite, per test folder structure are uploaded and attached to the matching cases automatically.
How do you consolidate parallel runs into one result?
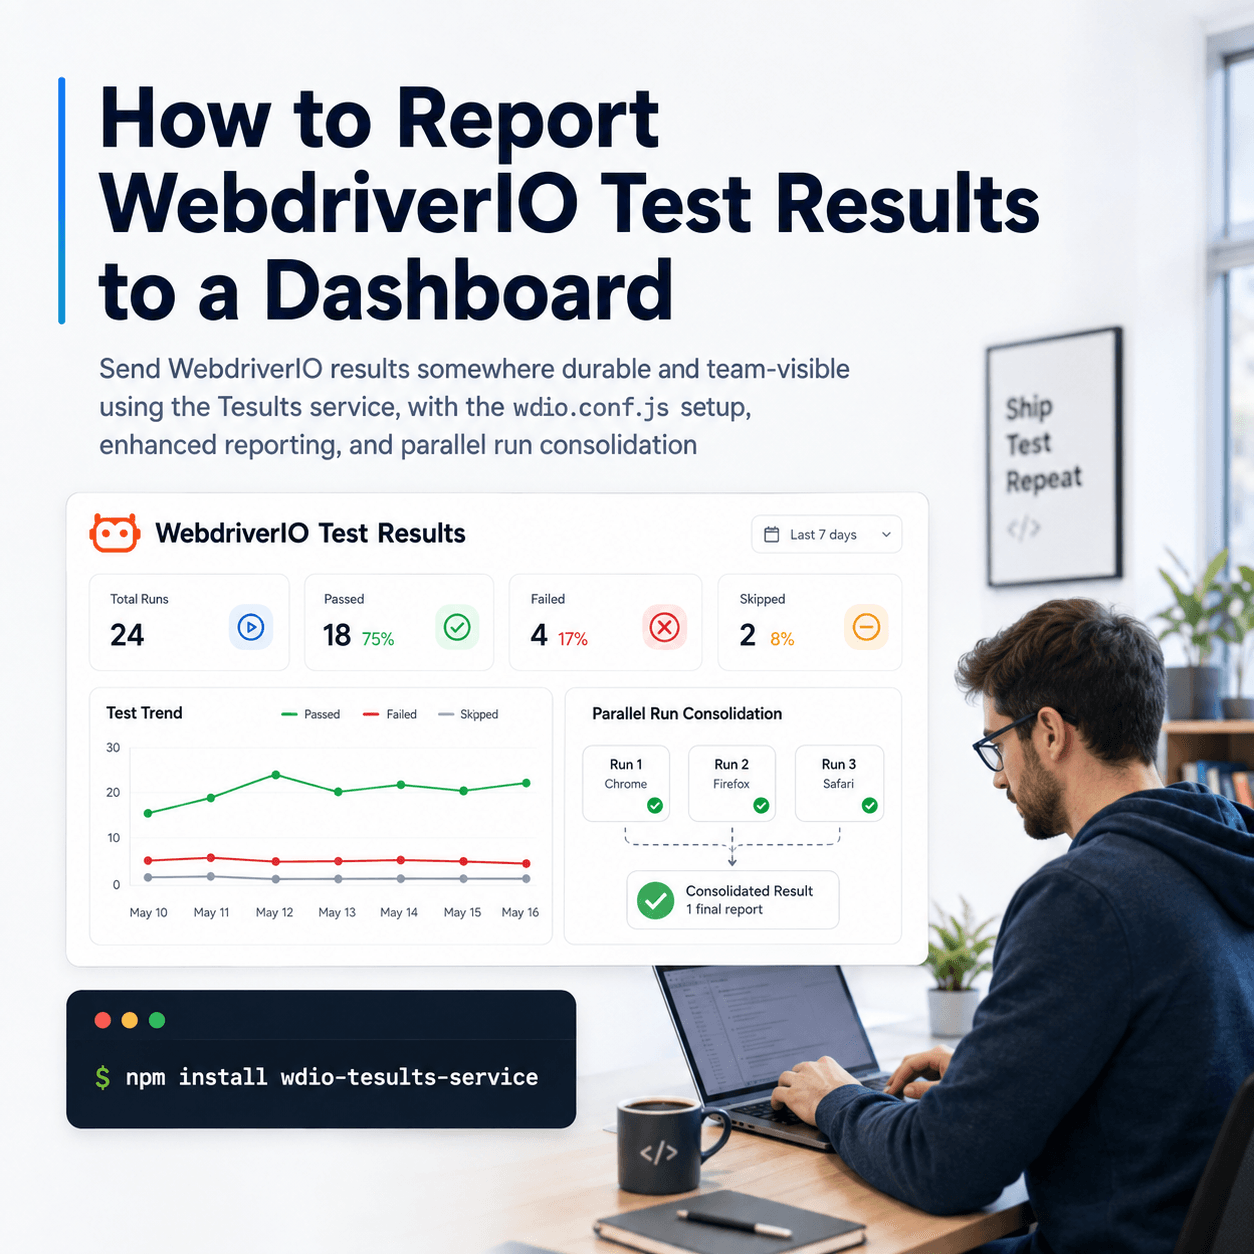
Cypress suites are often sharded across parallel CI machines for speed, and each shard submits its results separately, so by default Tesults records several test runs for what you think of as one run. Four shards become four runs, which is not what you want to look at.
Give every shard of the same logical run a shared build name, then enable Build Consolidation from the configuration menu. Submissions sharing a build name are merged into a single test run automatically. Report the build name and optional build details in the args:
const args = {
  target: 'eyJ0eXAi...',
  build_name: '1.0.0',
  build_result: 'pass',
  build_description: 'Build description',
  build_reason: 'If failed, provide build failed reason'
}
If there is no natural version to use as the build name, a timestamp captured when the run starts works as the shared identifier across shards.
How do you keep results comparable across runs?
Retaining Cypress results is only useful over time if each test is recognisable as the same test from one run to the next. Tesults matches cases across runs by suite and test name, so with data driven Cypress tests, keep the suite and test names static and put the variable values in the test description or a custom field. If the name changes every run, each run looks like a fresh set of tests, and you lose historical results analysis and failure assignment. Your tests stay as dynamic as you like; only the identifier stays fixed.
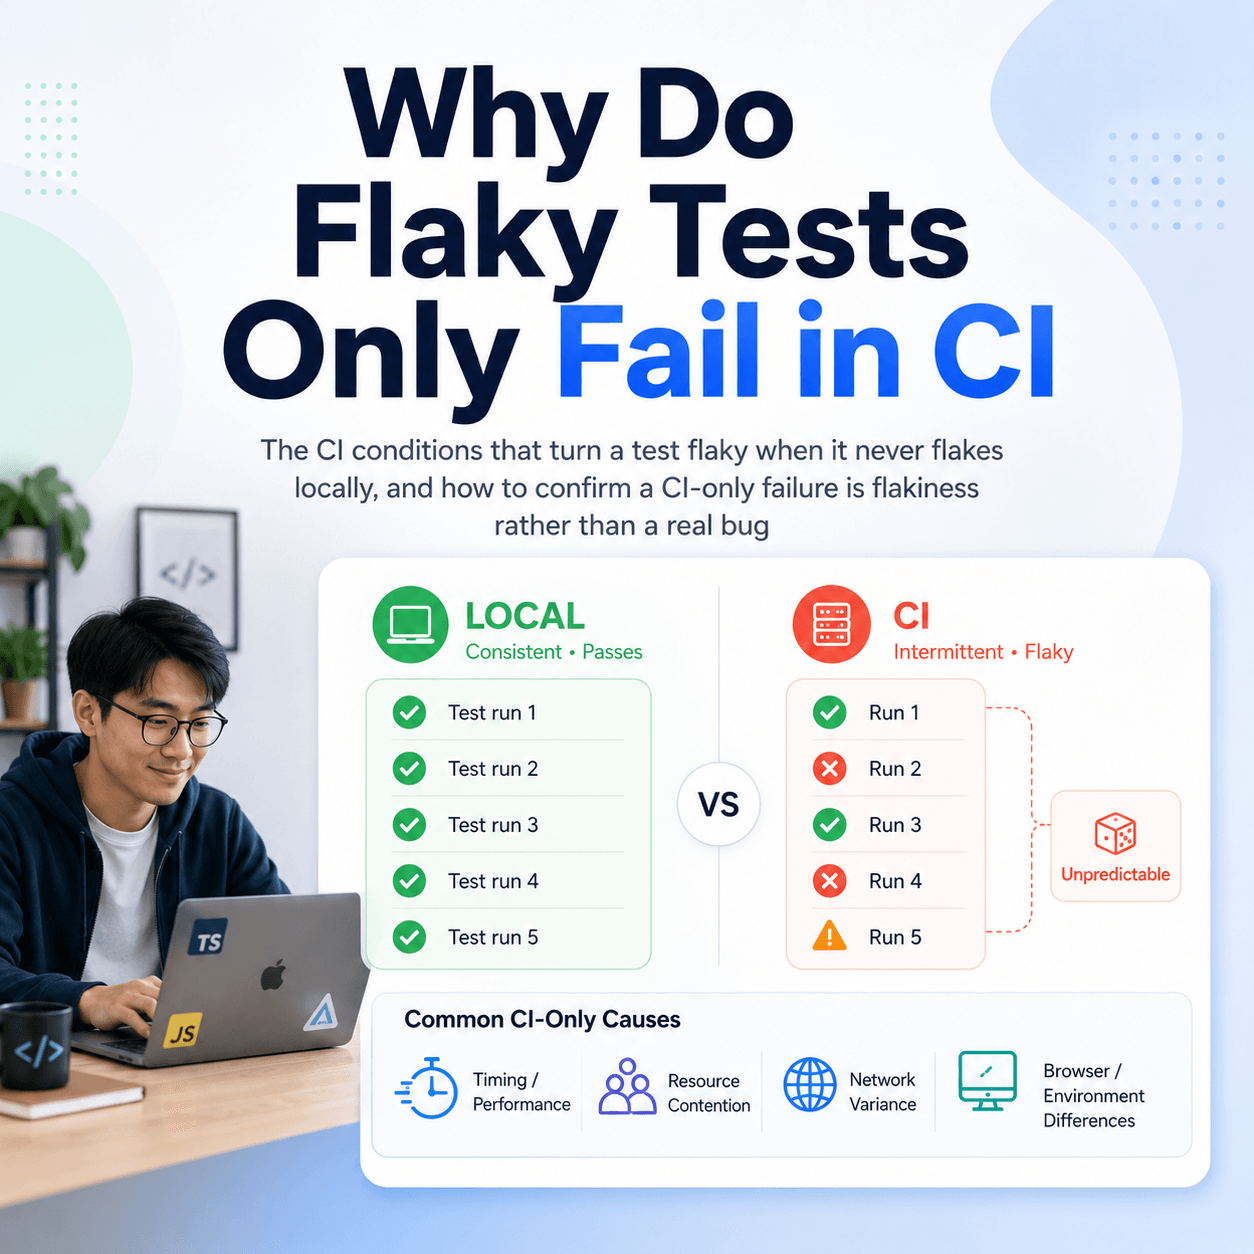
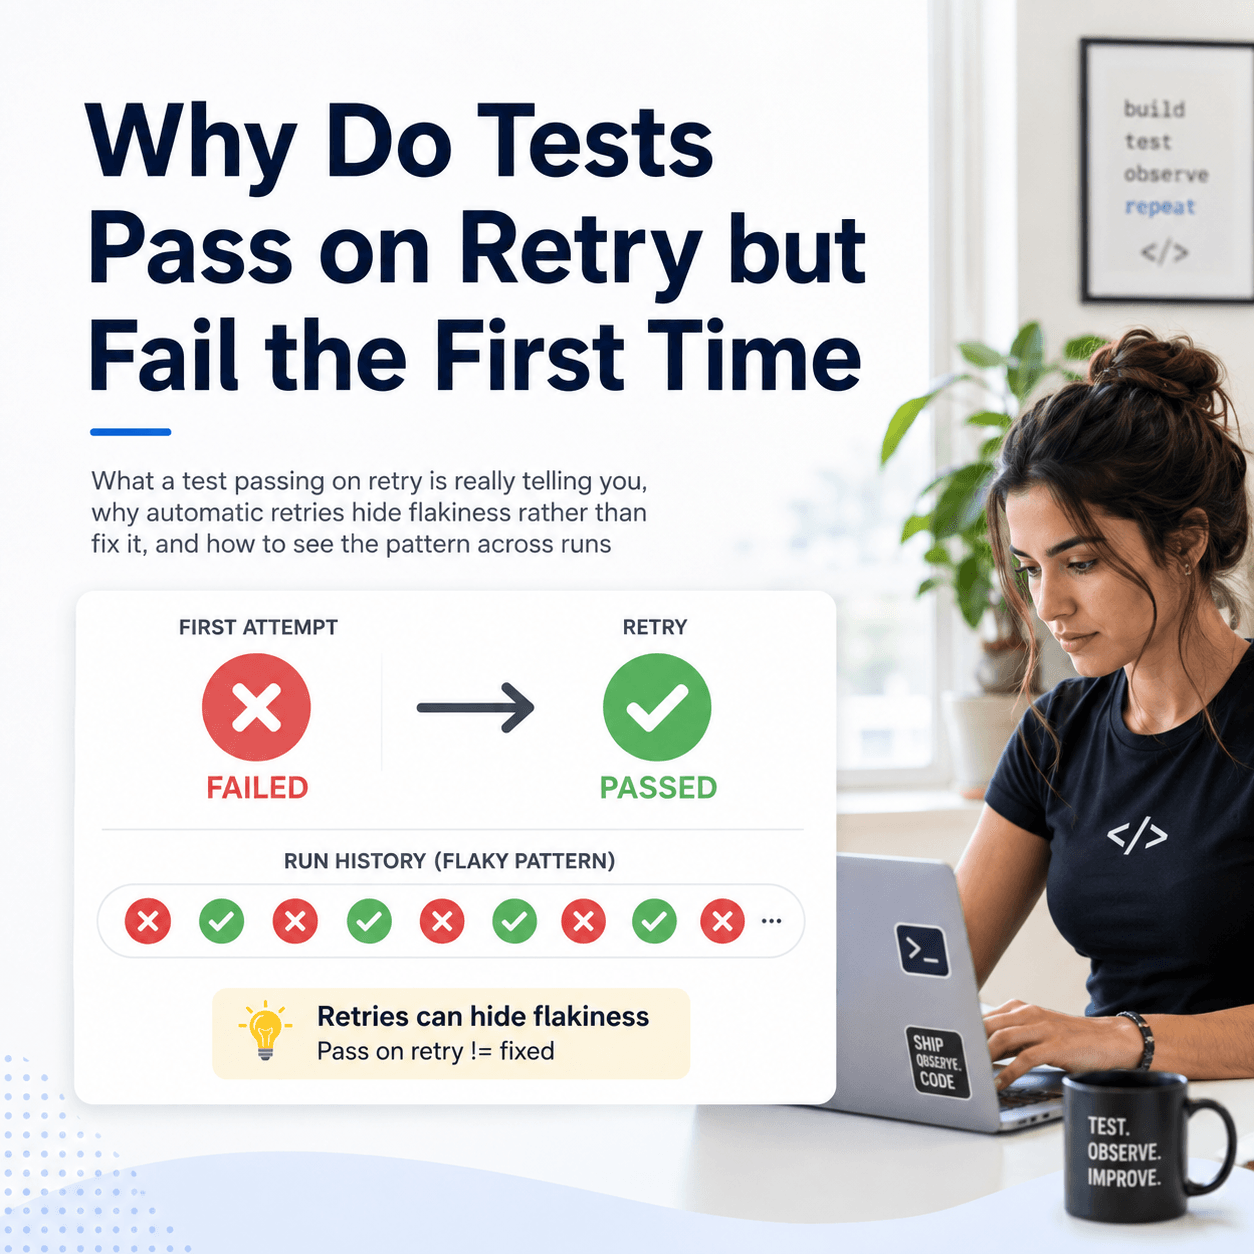
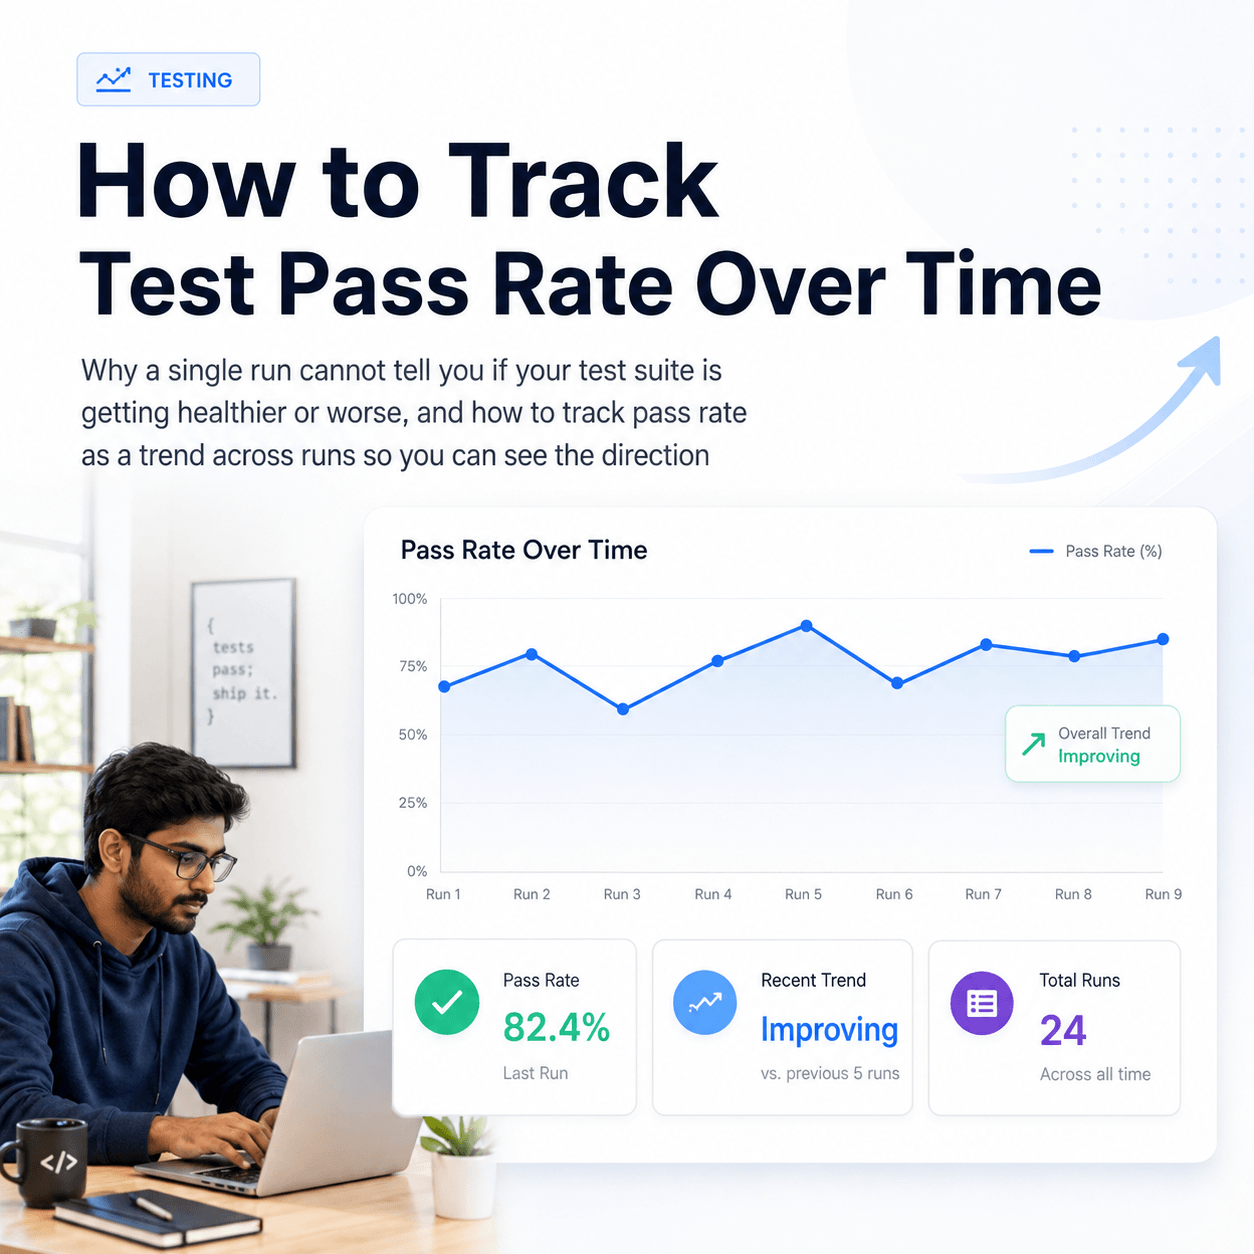
Once runs are retained and aligned, each Cypress test carries a history rather than a single outcome, so you can see which cases just started failing, which have been flaky, and how pass rate is trending, none of which the local Cypress output can tell you. That history is also what lets Tesults surface flaky Cypress tests automatically, which matters because browser and end to end tests are especially prone to flakiness. The broader approach is covered in how to detect and handle flaky tests.
The whole change is one install and a small runner script, and it leaves how you write your Cypress tests untouched. What you get back is results that outlive the local run, are visible to the whole team, carry their own screenshots and videos, and accumulate into a history you can act on, which is the kind of capability worth weighing when choosing a test automation reporting tool. Full configuration, custom file handling, and build options are documented in the Tesults Cypress documentation.