Why Cypress Tests Pass Locally but Fail in CI
The environment differences that cause Cypress failures in CI, and how to tell a real bug from an environment flake
Aug 8, 2026
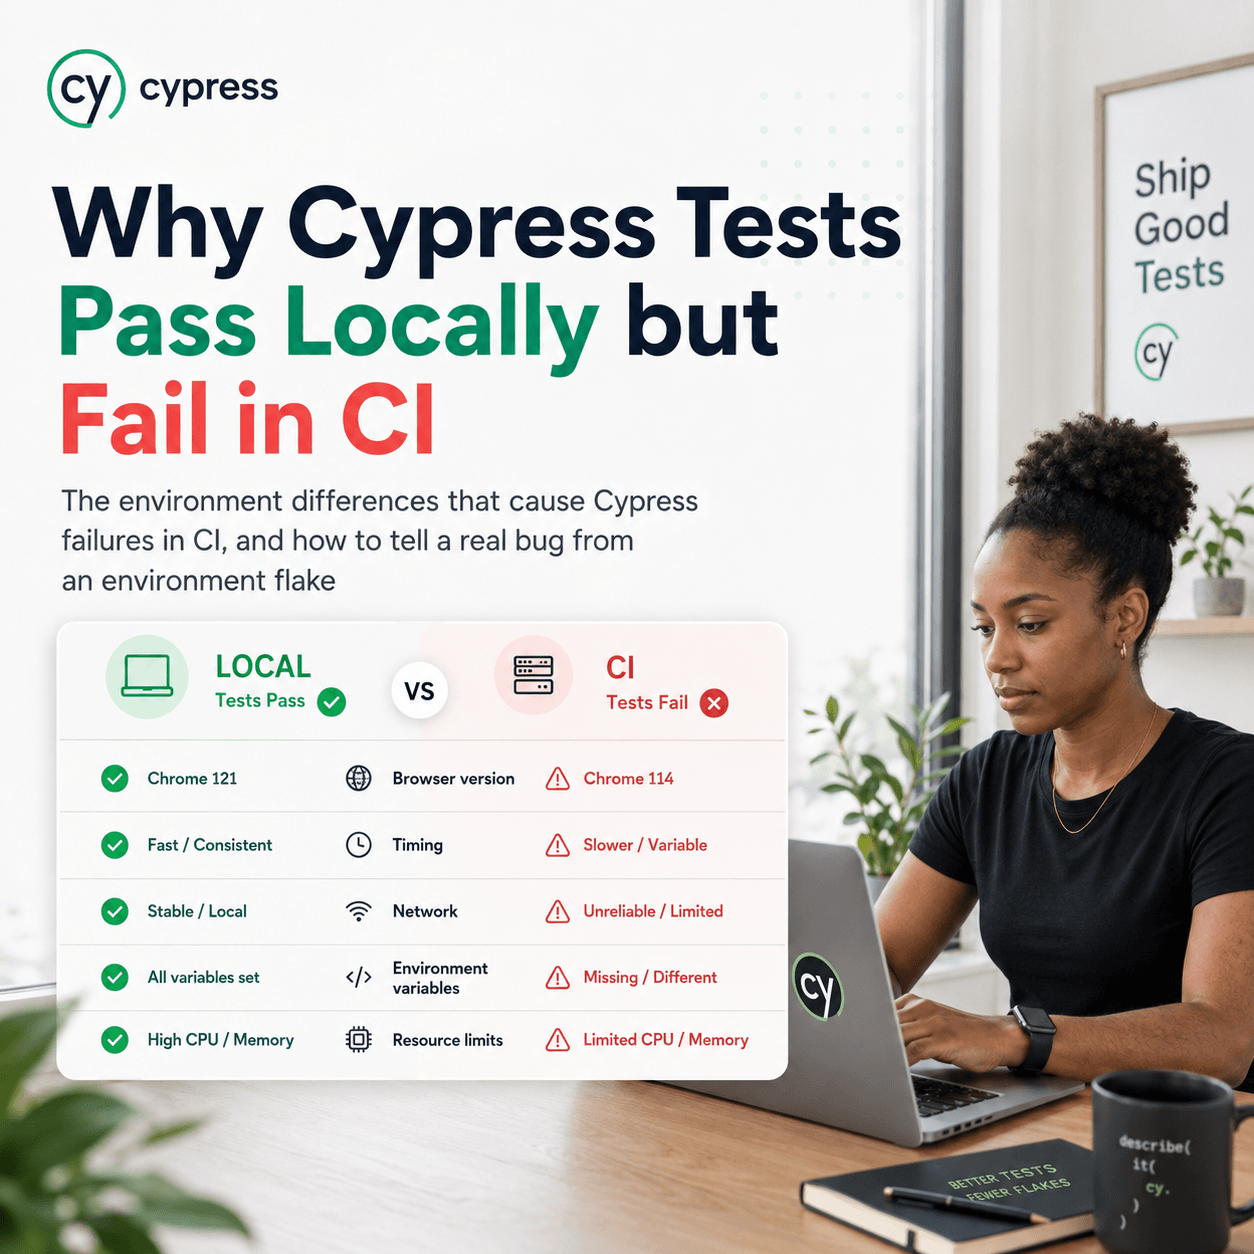
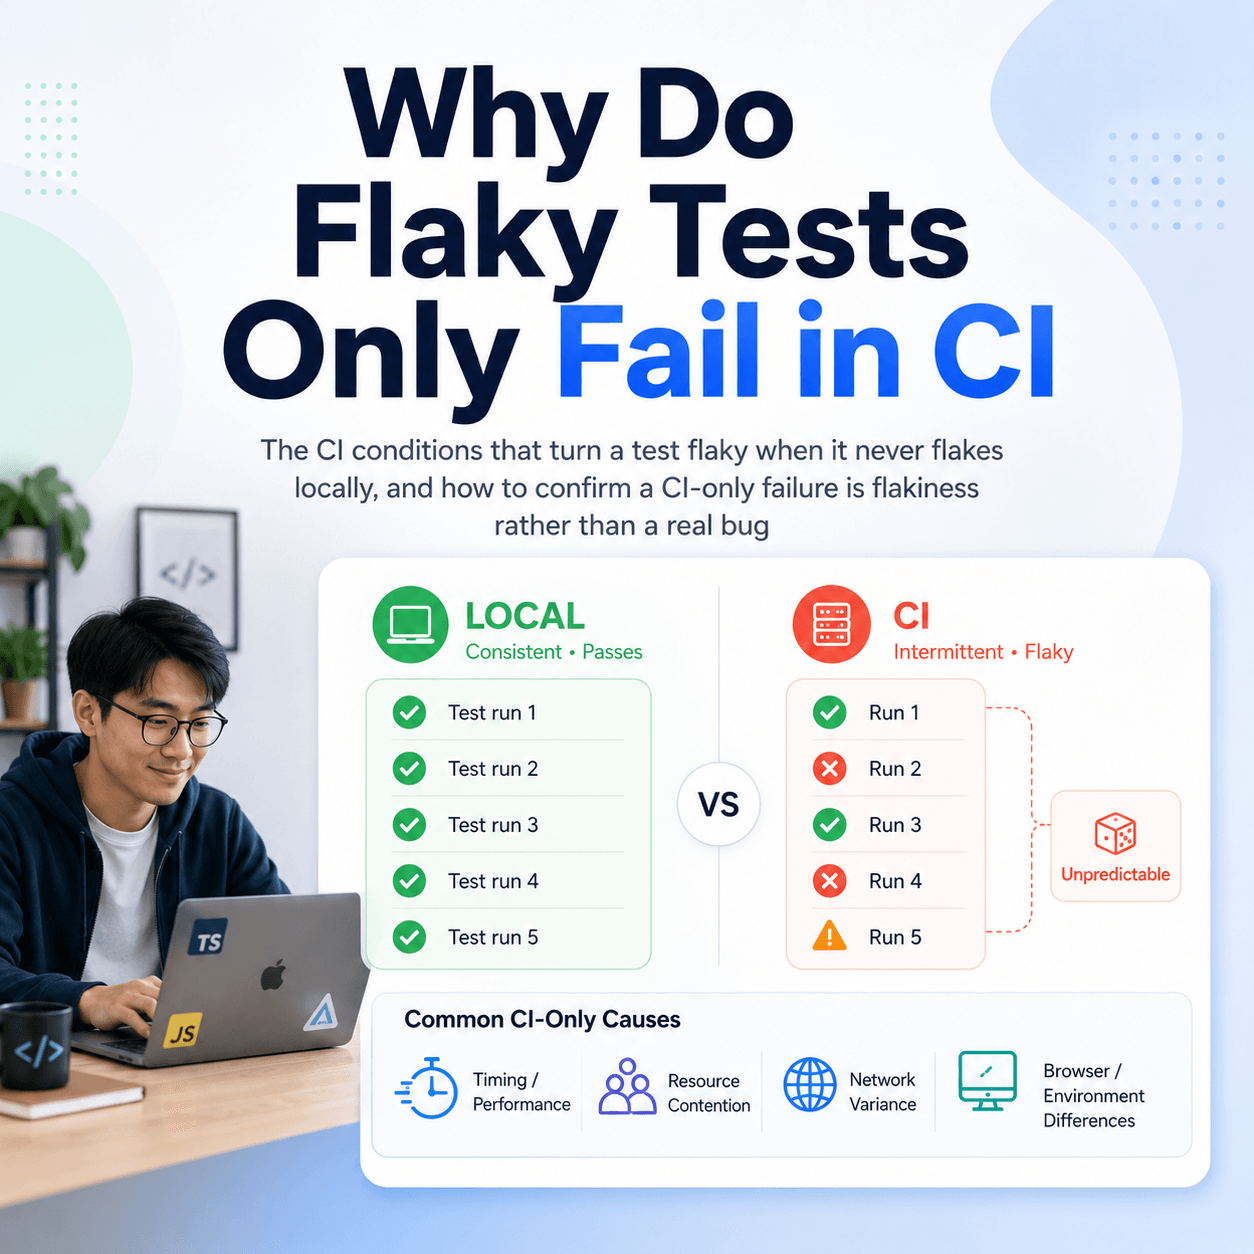
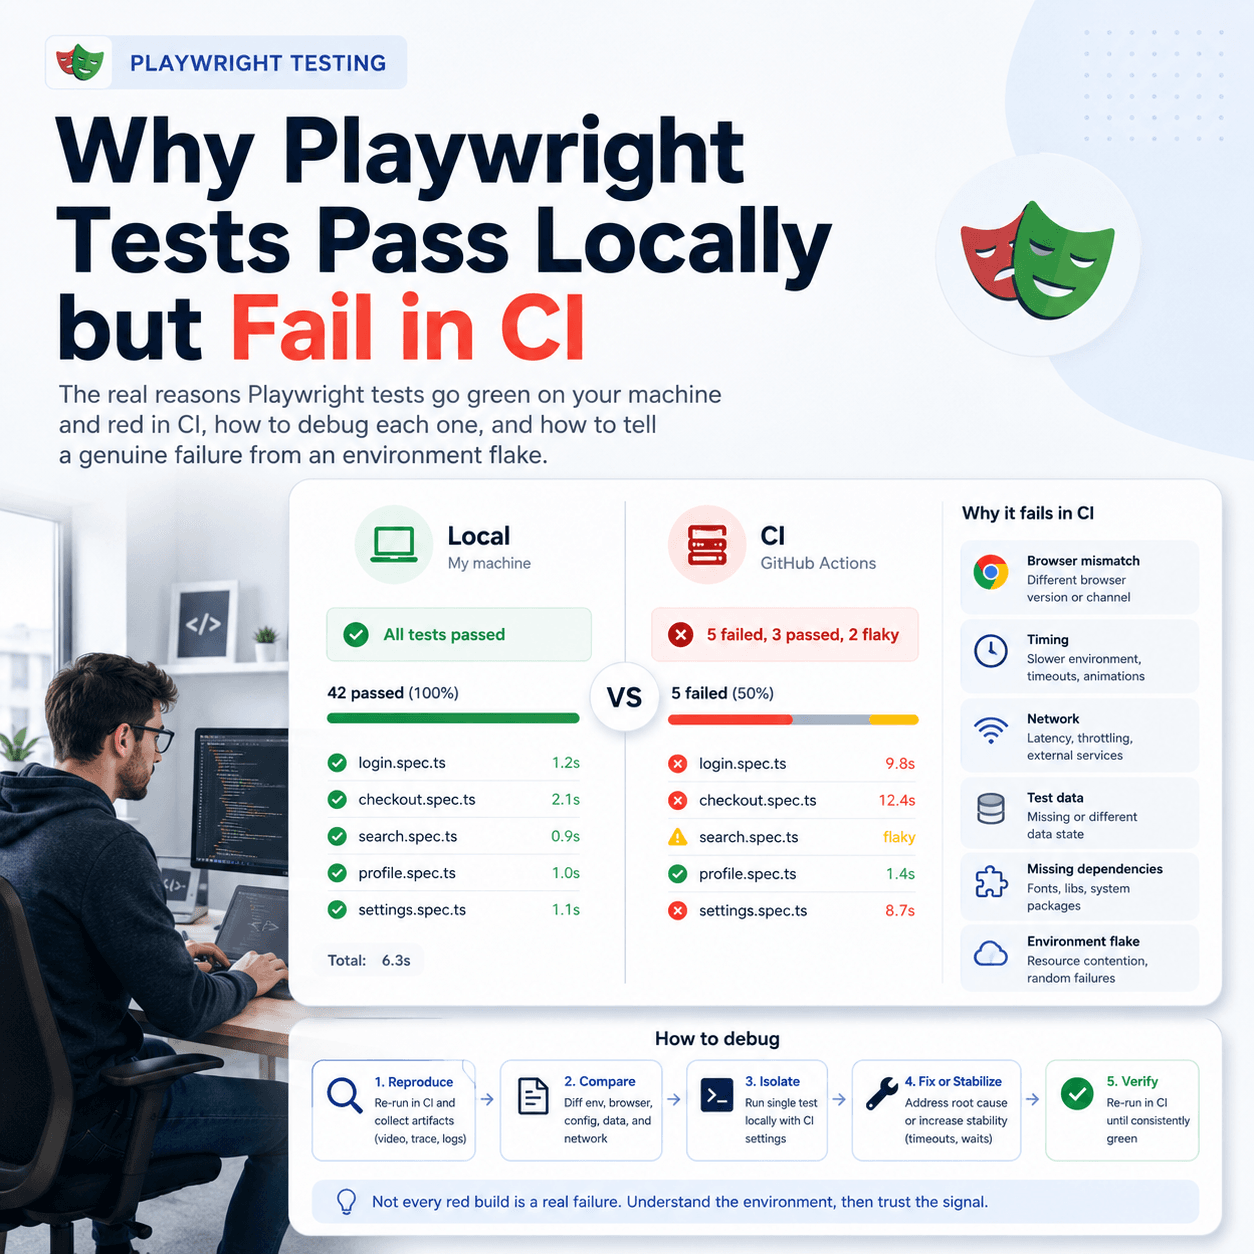
When a Cypress test passes on your machine and fails in CI, the test is almost never wrong about the application. It is usually right about the environment. CI machines are slower and more variable than a developer laptop, they start from clean state, they often run specs in parallel, and they record video while the test runs. Each of those changes timing, and Cypress failures are overwhelmingly timing failures. The practical work is separating the small number of genuine bugs from the larger number of environment artifacts, and the fastest way to do that is to look at how a test has behaved across many runs rather than staring at the one run that failed.
Why does CI behave differently from a local machine?
Cypress runs the same code in both places, so the difference is everything around the code.
CI machines are slower and shared. A typical hosted runner gives you two virtual CPUs and a few gigabytes of memory, shared with the browser, your application, any services you started, and the video encoder. Your laptop has more of everything and is not competing with a build queue. Anything that completes in 200ms locally may take 2 seconds in CI, and anything that took 2 seconds locally may take longer than the default timeout.
CI starts from nothing. No cached bundle, no warm database, no browser profile, no leftover local storage from the last time you ran the suite by hand. Tests that quietly depend on state left behind by an earlier session pass locally and fail on a clean machine.
CI usually runs specs in parallel. Multiple containers hitting the same backend at once creates contention that a single local run never produces.
CI records video by default. Video capture is not free, and on a constrained runner it competes with the browser for CPU.
Is it a real failure or a flaky test?
This is the question worth answering first, because it decides what you do next. A real failure means the application changed and the test caught it. A flake means the test result is not a reliable signal about the application at all.
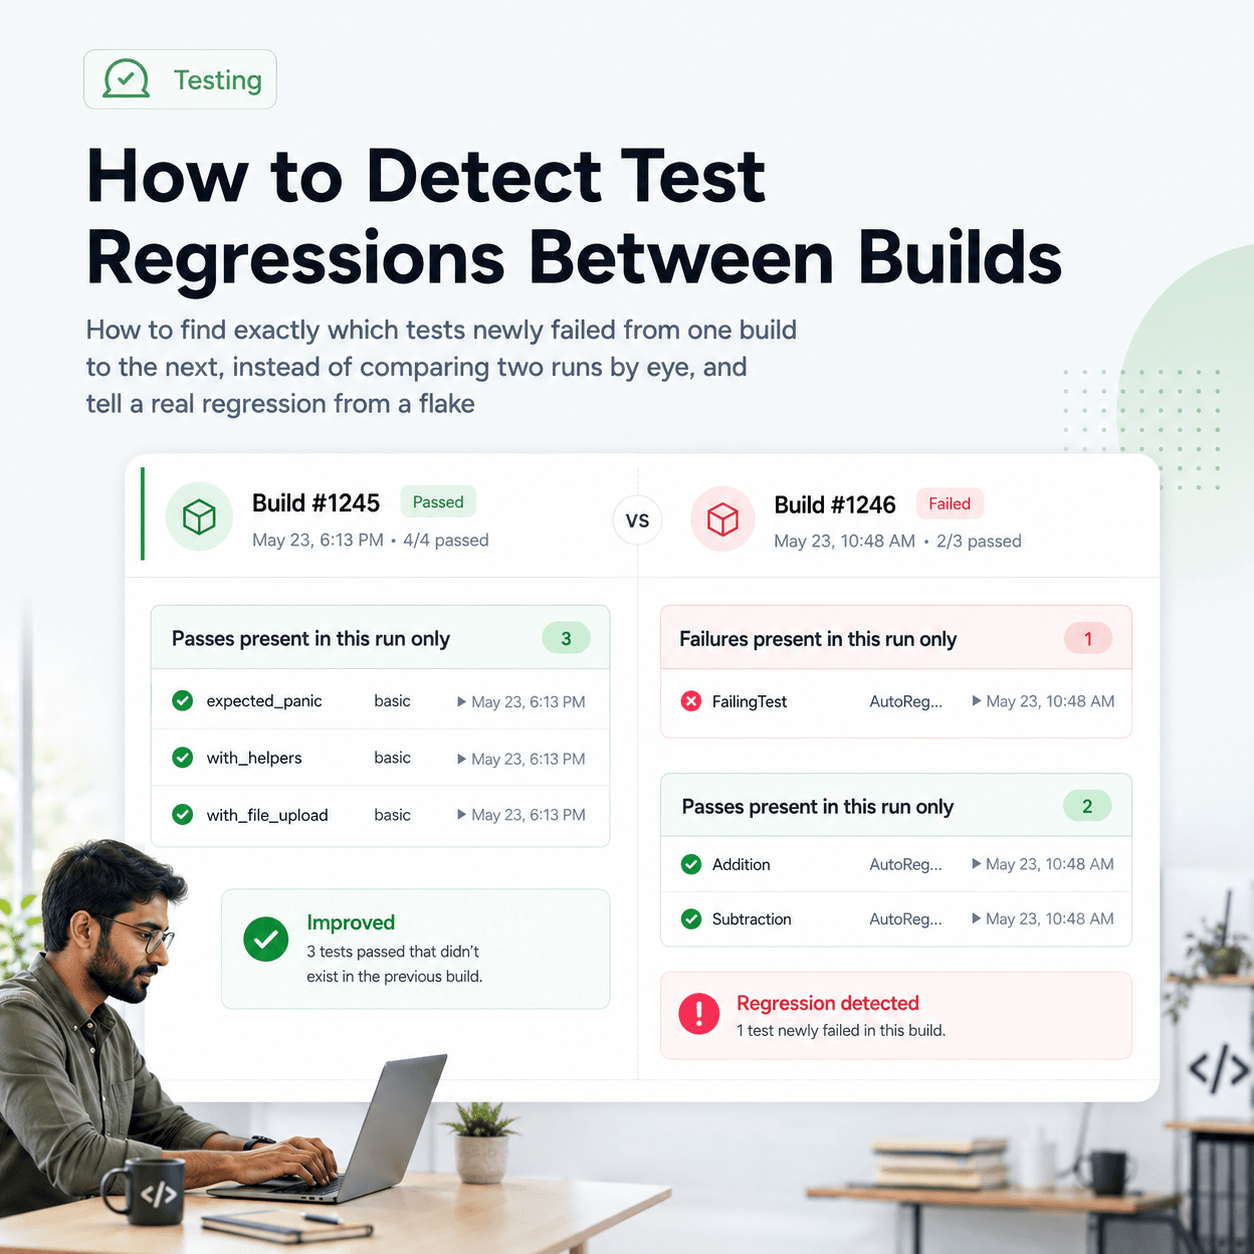
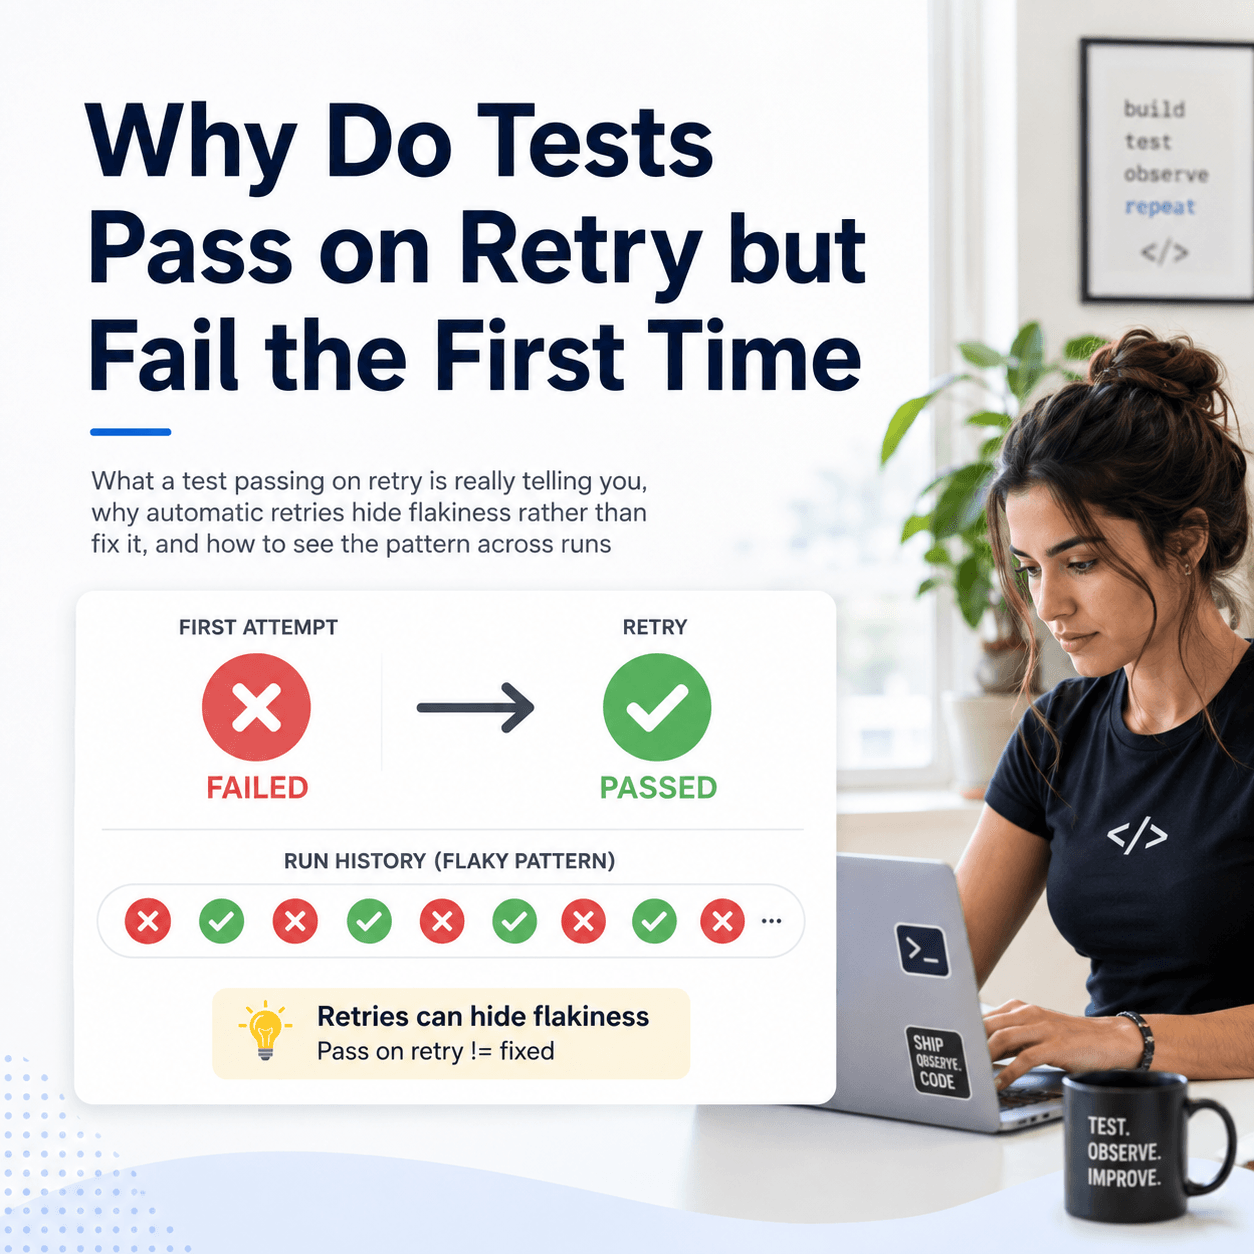
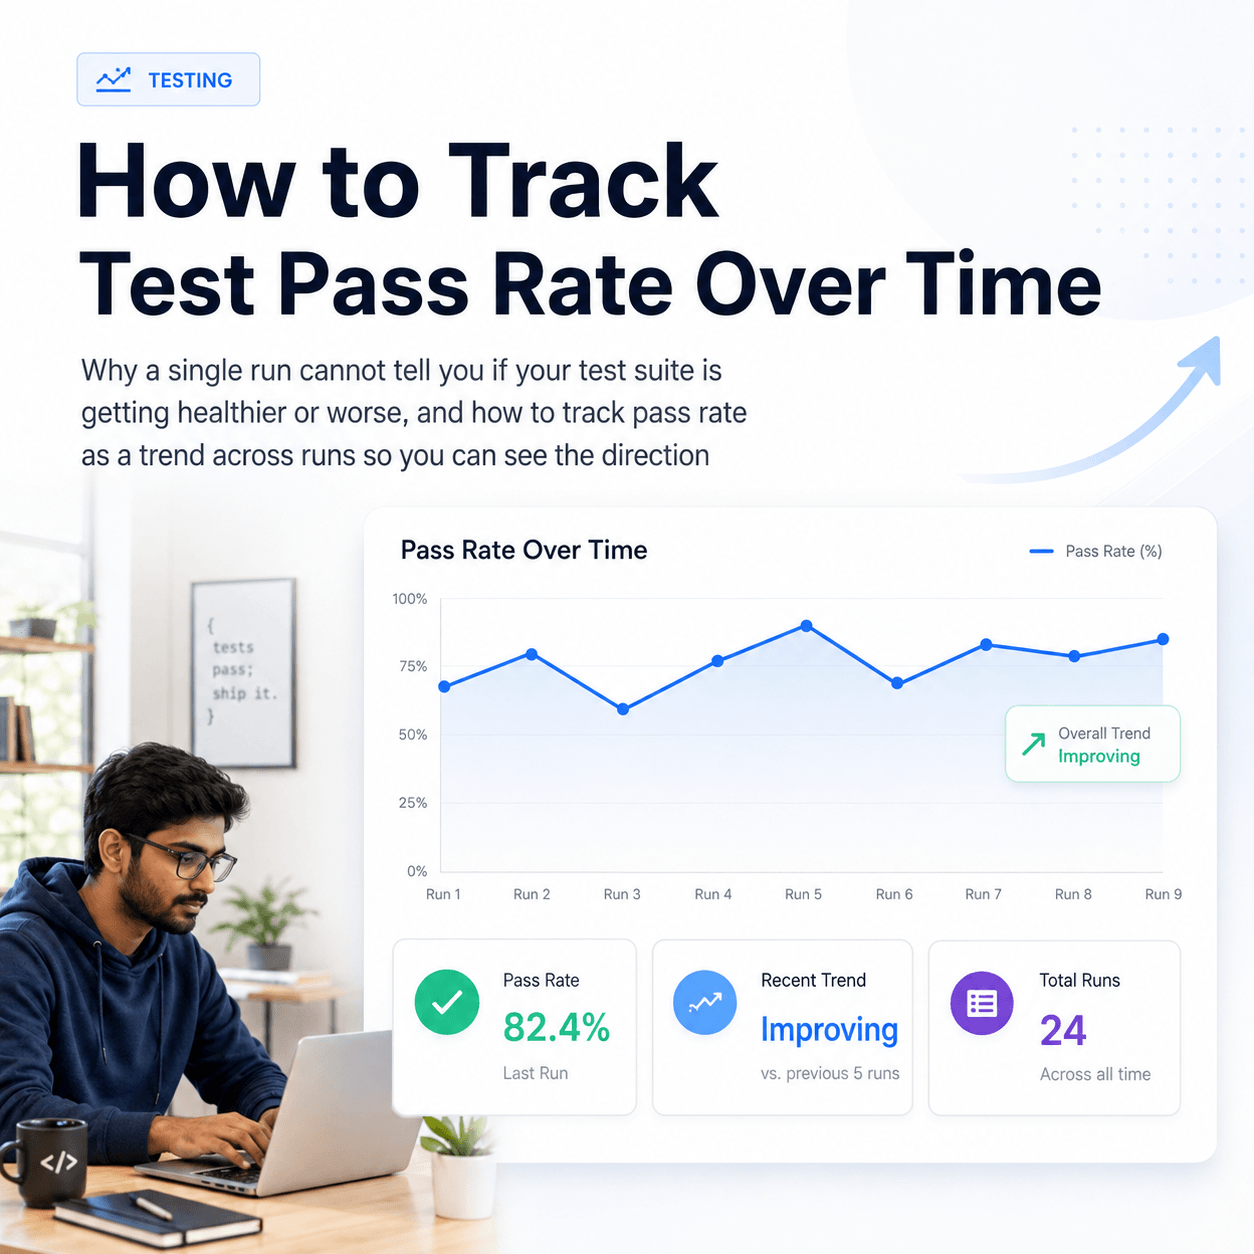
A single failed run cannot tell you which one you have. The distinguishing evidence is history. A test that has failed once and passed thirty times, with no corresponding change to the code it covers, is behaving like a flake. A test that started failing at a specific build and has failed consistently since is behaving like a genuine regression. Same red result, completely different response.
The practical consequence is that if your CI pipeline throws away results after each run, you are answering this question from memory every time, which is why teams end up rerunning the suite and hoping instead of diagnosing. The broader approach to finding and handling these is covered in how to detect and handle flaky tests.
Which timing problems show up only in CI?
Fixed waits. A cy.wait(500) that was tuned on a fast laptop is a guess that CI will eventually fail. Wait for the condition instead of the clock. Alias the request and wait on it, or assert on the state you actually care about, and let Cypress retry until it is true.
cy.intercept('GET', '/api/orders').as('getOrders')
cy.visit('/orders')
cy.wait('@getOrders')
cy.get('[data-cy=order-row]').should('have.length', 12)
Default timeouts tuned for local speed. Cypress defaults to 4 seconds for most commands. That is generous on a laptop and tight on a loaded runner, particularly for the first page load of a cold application. Raising defaultCommandTimeout and pageLoadTimeout for CI runs is legitimate, not a hack, as long as you are compensating for a slower machine rather than papering over an application bug.
Assertions that break retry-ability. Cypress retries the last assertion in a chain, but only if the chain is retryable. Storing an element in a variable, or interleaving non-Cypress code, quietly disables that retry and turns a timing tolerance into a hard failure the moment CI runs slower.
Animations. A transition that finishes before the next command locally can still be running in CI, so the click lands on a moving target or an element the browser considers not yet actionable.
Is state leaking between tests?
Tests that depend on order pass locally because you tend to run the whole suite in the same sequence every time. In CI, parallelization splits specs across containers and the order changes. A test that assumed a record created by an earlier spec now runs first, or runs somewhere that record never existed.
The fix is unglamorous. Each spec should create the state it needs and not rely on anything a previous spec did. Seed through API calls in beforeEach rather than driving the UI, since it is faster and less fragile, and reset anything you mutate.
Does the viewport or rendering differ?
Cypress uses a fixed default viewport, so this bites less often than with other runners, but it still bites. If you open the interactive runner locally at a larger size, or your application makes layout decisions based on available height, an element that is visible locally can sit below the fold in CI. Cypress refuses to act on elements it considers not visible, and the resulting error looks like the element is missing rather than out of view.
Set the viewport explicitly in your configuration so local and CI agree, and check the failure screenshot before assuming the element failed to render at all.
What breaks when specs run in parallel?
Parallelization surfaces every shared resource in the system. Two containers seeding the same test user, competing for the same database rows, or exhausting a rate limit will produce failures that no single local run can reproduce. If your tests share a backend, give each parallel worker its own namespace: unique user accounts, unique record identifiers, unique tenant where the application supports it.
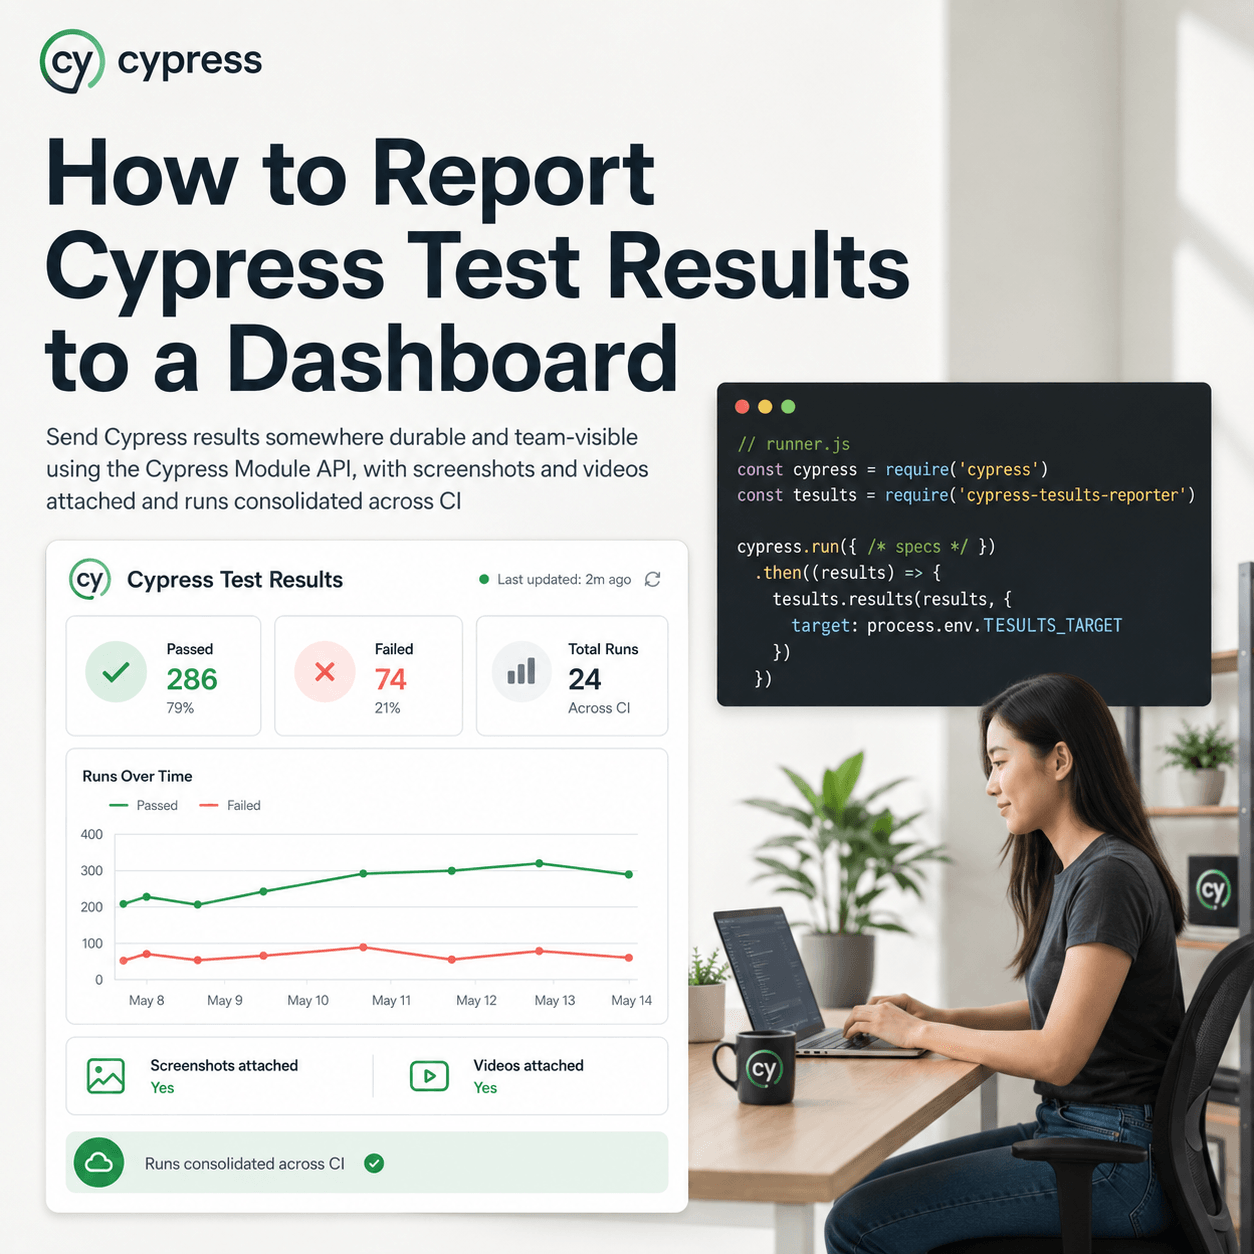
Parallelization also fragments your reporting, because each container submits its own results. Consolidating those parallel submissions into one run is handled with build consolidation, covered in how to report Cypress test results to a dashboard.
How do you tell a real failure from an environment flake?
All of the above narrows the causes. What actually resolves the question is the run history for that specific test.
Tesults keeps every run rather than replacing the last one, so a failing test can be read in context. If a test alternates between pass and fail more than twice across the runs analysed, Tesults flags it as flaky and collects it in a dedicated flaky section in the Supplemental view, with flagged cases marked by a snowflake symbol. That is a deterministic reading of the result history, not a guess about the cause.
The distinction matters more than it sounds. Knowing that a test failed tells you to look. Knowing that it has failed four times in the last forty runs, always on a different assertion, tells you the problem is the environment and not the checkout flow. Knowing that it passed for three months and has failed on every run since Tuesday tells you to look at what shipped on Tuesday.
Screenshots and videos recorded by Cypress upload automatically alongside the result, so the evidence for a specific failure sits with the run it came from instead of expiring with the CI job artifacts.
How do you report Cypress results from CI?
Cypress reports to Tesults through the Cypress Tesults Reporter, which uses the Cypress Module API, so you start Cypress from a runner file rather than a configuration hook, and screenshots and videos captured by the built-in Cypress functions are saved automatically. The full setup, including the runner file and build consolidation for parallel containers, is covered step by step in how to report Cypress test results to a dashboard, with complete reference in the Cypress documentation.
One thing that undermines all of this
Dynamically generated test names. If a test is named after a value that changes every run, Tesults sees a new test case each time rather than the same case with a history, and every feature that depends on history stops working, including flaky detection and failure assignment. Keep the suite and test names static and put the variable data in the test description or a custom field. Your tests stay just as dynamic and you keep the history that makes CI failures diagnosable.
Most Cypress failures that appear only in CI are the suite telling you something true about timing, isolation, or resources. The reason they are frustrating is not that they are hard to fix individually, it is that without run history every failure arrives with no context and gets triaged from scratch. Keeping results across runs turns that into a much smaller question: has this test done this before, and if so, how often.