How to View Playwright Test Results in CI
How to get Playwright results out of the CI console and into a durable dashboard, including parallel shards, screenshots, and retained history
Jul 21, 2026
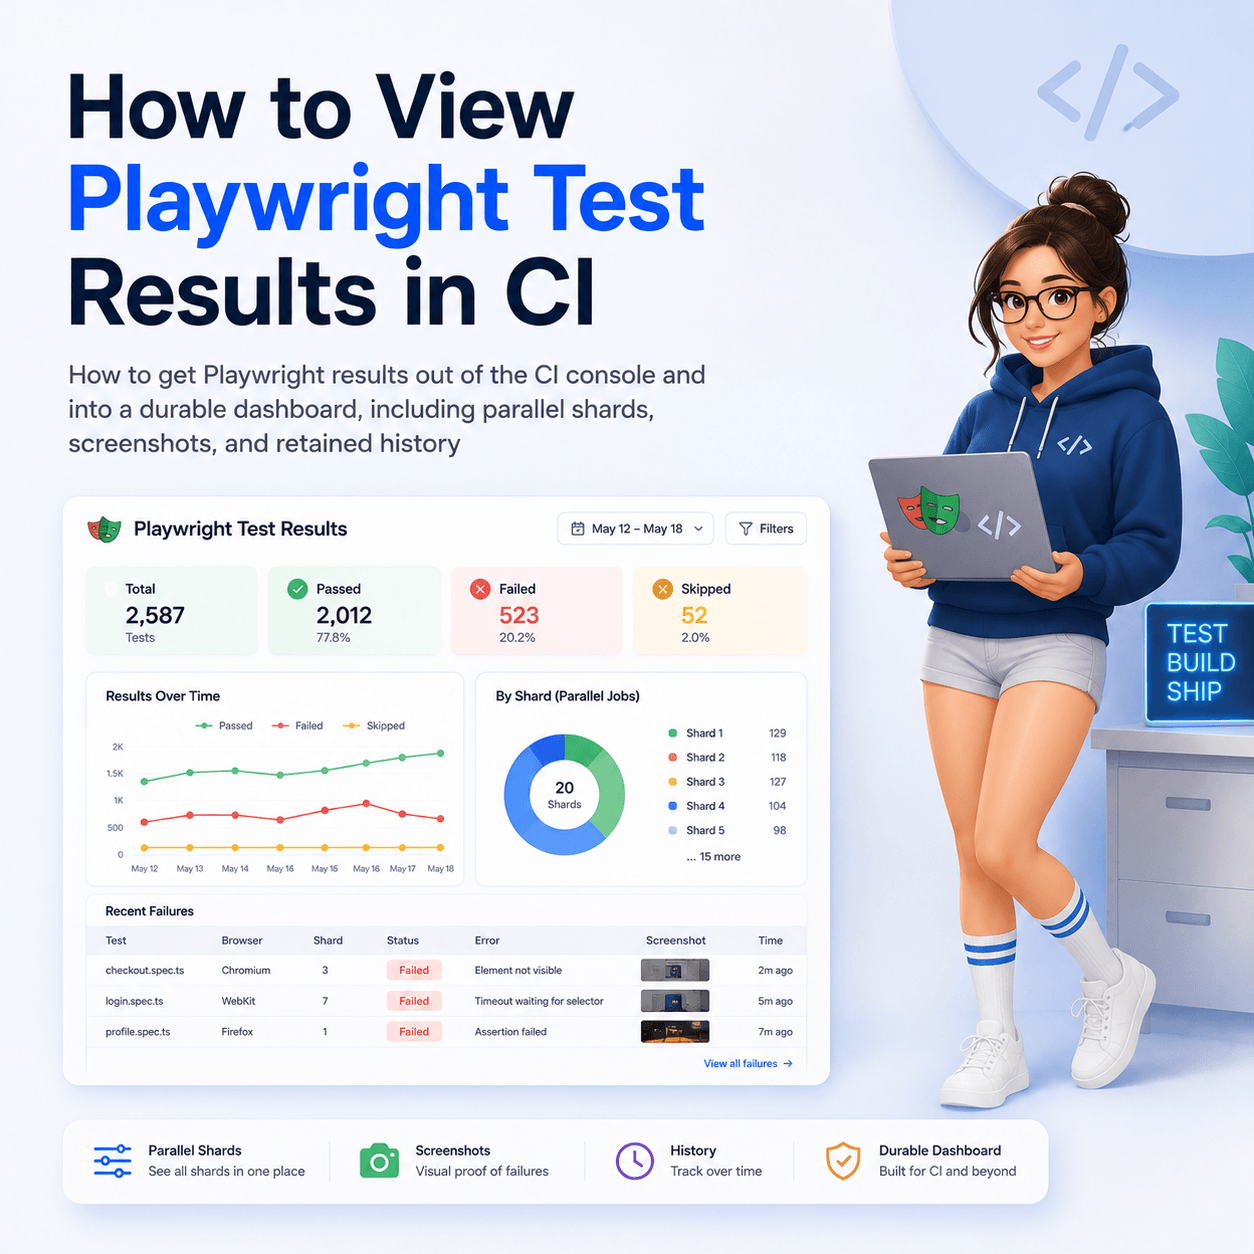
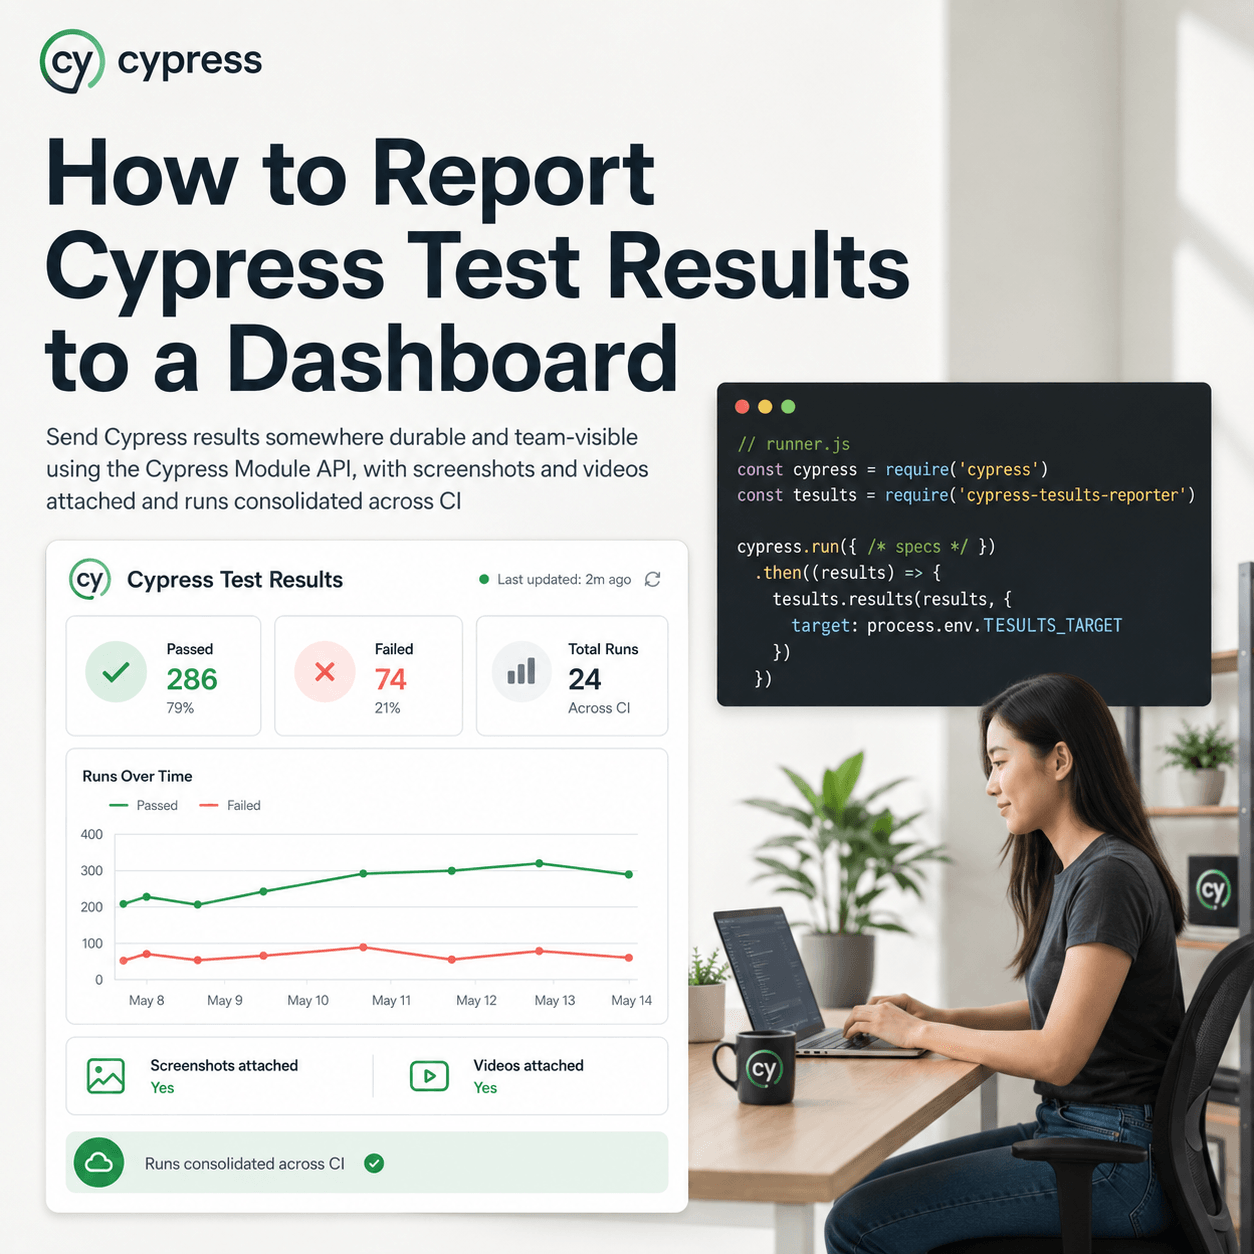
In CI, Playwright's own HTML report is awkward: it is written to the runner's filesystem, which is thrown away when the job ends, so viewing it means archiving an artifact, downloading it, and opening it locally. To actually view Playwright results in CI you send them somewhere that outlives the run. The playwright-tesults-reporter does this: add it as a reporter, pass a target token, and every CI run pushes its results to a dashboard you open in a browser, with screenshots attached, parallel shards consolidated into one run, and history kept across runs. This is how you see a Playwright run without downloading anything, and how you compare today's run to last week's.
Why is the built in HTML report awkward in CI?
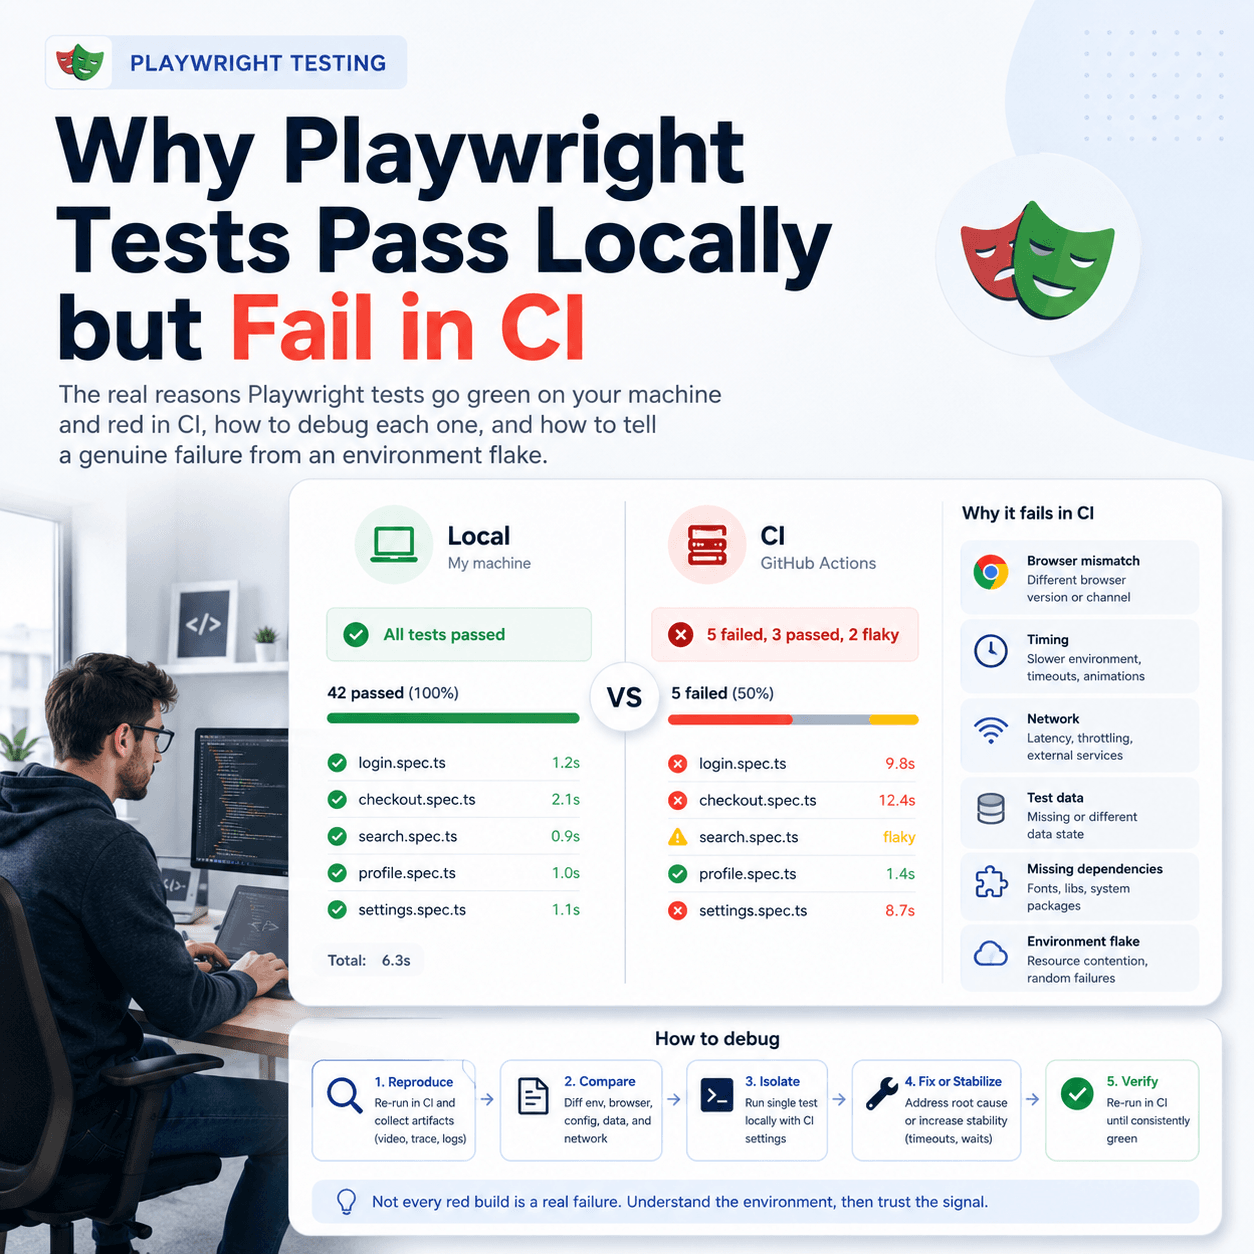
Playwright's HTML reporter is genuinely good when you run locally. It opens in your browser the moment the run finishes because the files are right there on your machine. In CI that assumption breaks. The report is written to the CI runner's filesystem, and that filesystem is ephemeral, it is gone when the job completes. To see the report you have to configure the job to archive it as a build artifact, wait for the job to finish, download the zip, extract it, and open it. Every time.
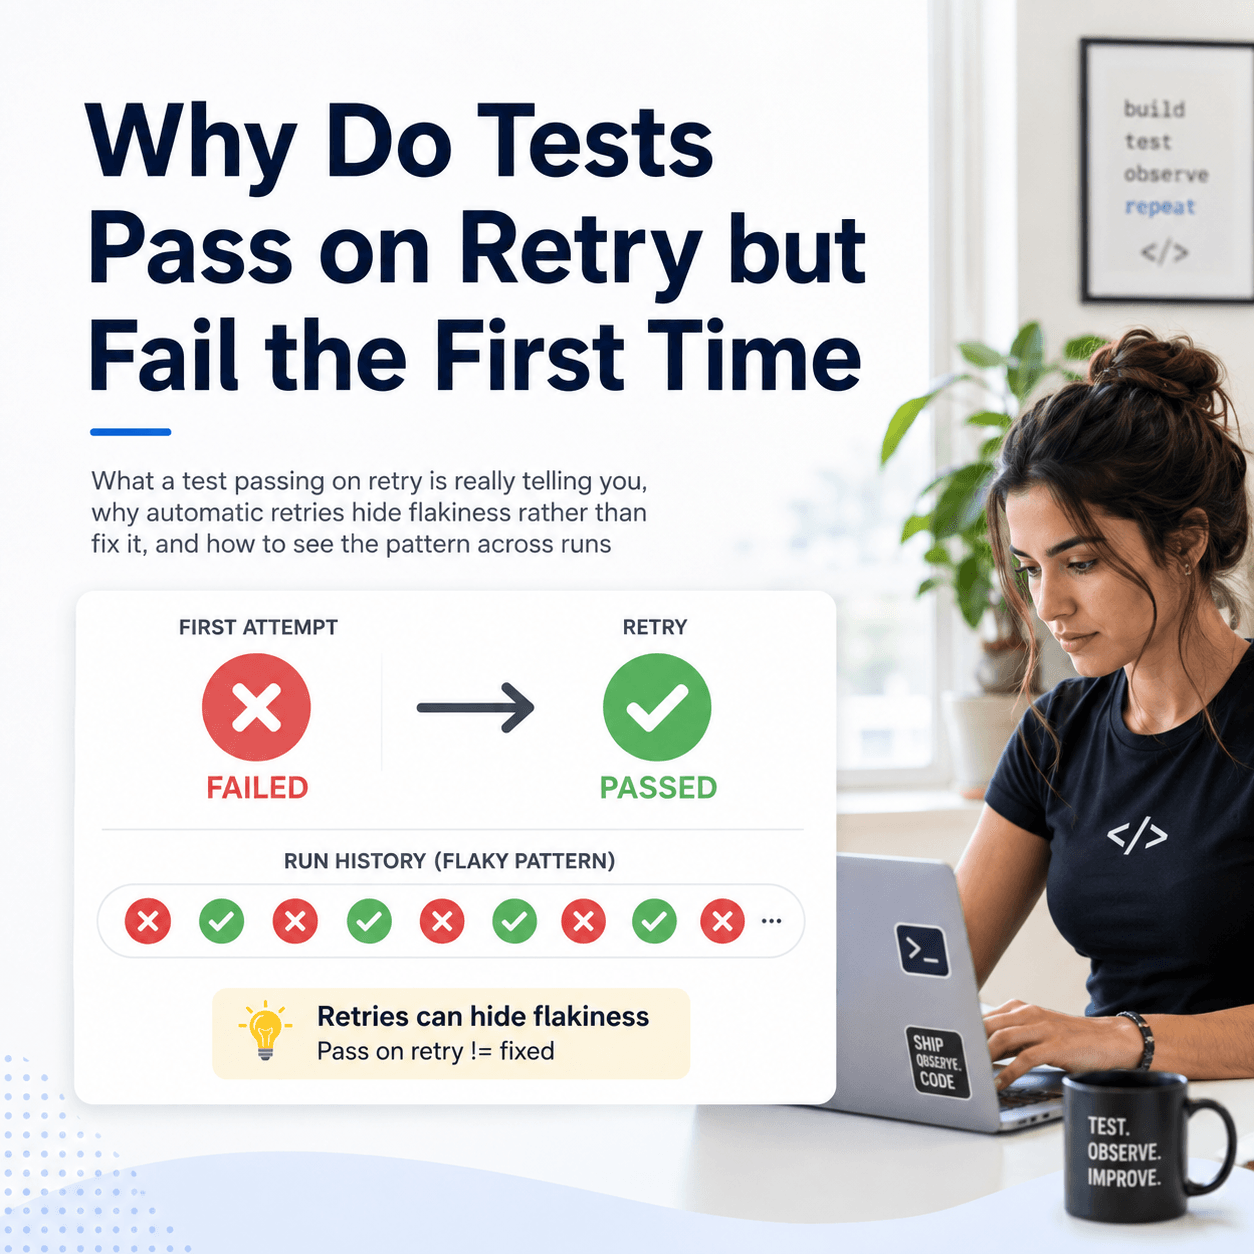
And even once you have it, each report is a single run in isolation. It cannot tell you whether a failure is new, because it has no memory of the previous run. In CI, where the whole point is running the suite repeatedly, a report that forgets everything between runs is missing the dimension you most need.
How do you send Playwright results to a dashboard?
Install the reporter Tesults supplies for Playwright:
npm install playwright-tesults-reporter --save
Add it as a reporter in your Playwright config. It can run alongside Playwright's own reporters, so you do not have to give up the HTML report to add this:
const config = {
  reporter: [['playwright-tesults-reporter', {'tesults-target': 'token'}]]
}
Replace token with your Tesults target token, which you get when you create a project or target and can regenerate from the configuration menu. Then run Playwright exactly as you already do:
npx playwright test
That is the whole integration. When the CI job runs the suite, results are pushed to Tesults and become a run you open in a browser, no artifact archiving, no download, no local extraction. The tesults-target argument is what triggers the upload; if it is not supplied the reporter does nothing, which means the same config is safe to run locally without polluting your dashboard.
How do you keep the token out of your config?
Committing a raw token into playwright.config.js is not what you want in CI. Keep it in the environment instead and read it in. The reporter docs show the pattern using a .env file with dotenv, and the same approach works with the environment variables your CI provider injects as secrets:
require('dotenv').config();

const config = {
  reporter: [['playwright-tesults-reporter', {'tesults-target': process.env.TARGET1}]]
}
In CI you would set TARGET1 as a secret in the pipeline configuration rather than in a committed file. The config reads the same either way, which keeps local and CI runs consistent.
How do you handle parallel shards without fragmenting the run?
This is the question that separates viewing Playwright results in CI from viewing them locally. CI commonly shards the suite across parallel machines for speed, and each shard submits its results independently. By default Tesults treats each submission as its own test run, so a suite split across four shards shows up as four runs, which is not what you want to look at.
The fix is to give every shard of the same logical run a shared build name, then enable Build Consolidation from the configuration menu. With consolidation on, submissions that share a build name are merged into a single test run automatically, no matter when each shard finishes. Report a build name through the reporter:
const config = {
  reporter: [['playwright-tesults-reporter', {
    'tesults-target': process.env.TARGET1,
    'tesults-build-name': process.env.BUILD_ID
  }]]
}
If you do not have a natural version number to use, a timestamp captured when the run starts works as a shared identifier across shards. The result is that four shards produce one coherent run in the dashboard rather than four fragments you have to mentally reassemble.
How do you get screenshots and traces from a CI failure?
A failure in CI is hard to act on without the artifacts, and downloading them from the runner is the same friction as the report. The reporter uploads them for you. Any file attached during a test with Playwright's built in attach method is automatically sent to Tesults and shown on that test case:
await page.screenshot({path: 'screenshot.png', fullPage: true});
await testInfo.attach('screenshot.png', {path: 'screenshot.png'});
So a failing test in the dashboard carries its own screenshot, and whatever else you attach, right there on the case. One caution worth heeding from the docs: file upload speed depends on your network, and the run blocks at the end while uploading. Attach a reasonable number of files per test rather than everything, and when first integrating, get results flowing without files before adding them, so you can confirm the setup independently of upload volume.
What can you see once results are in CI over time?
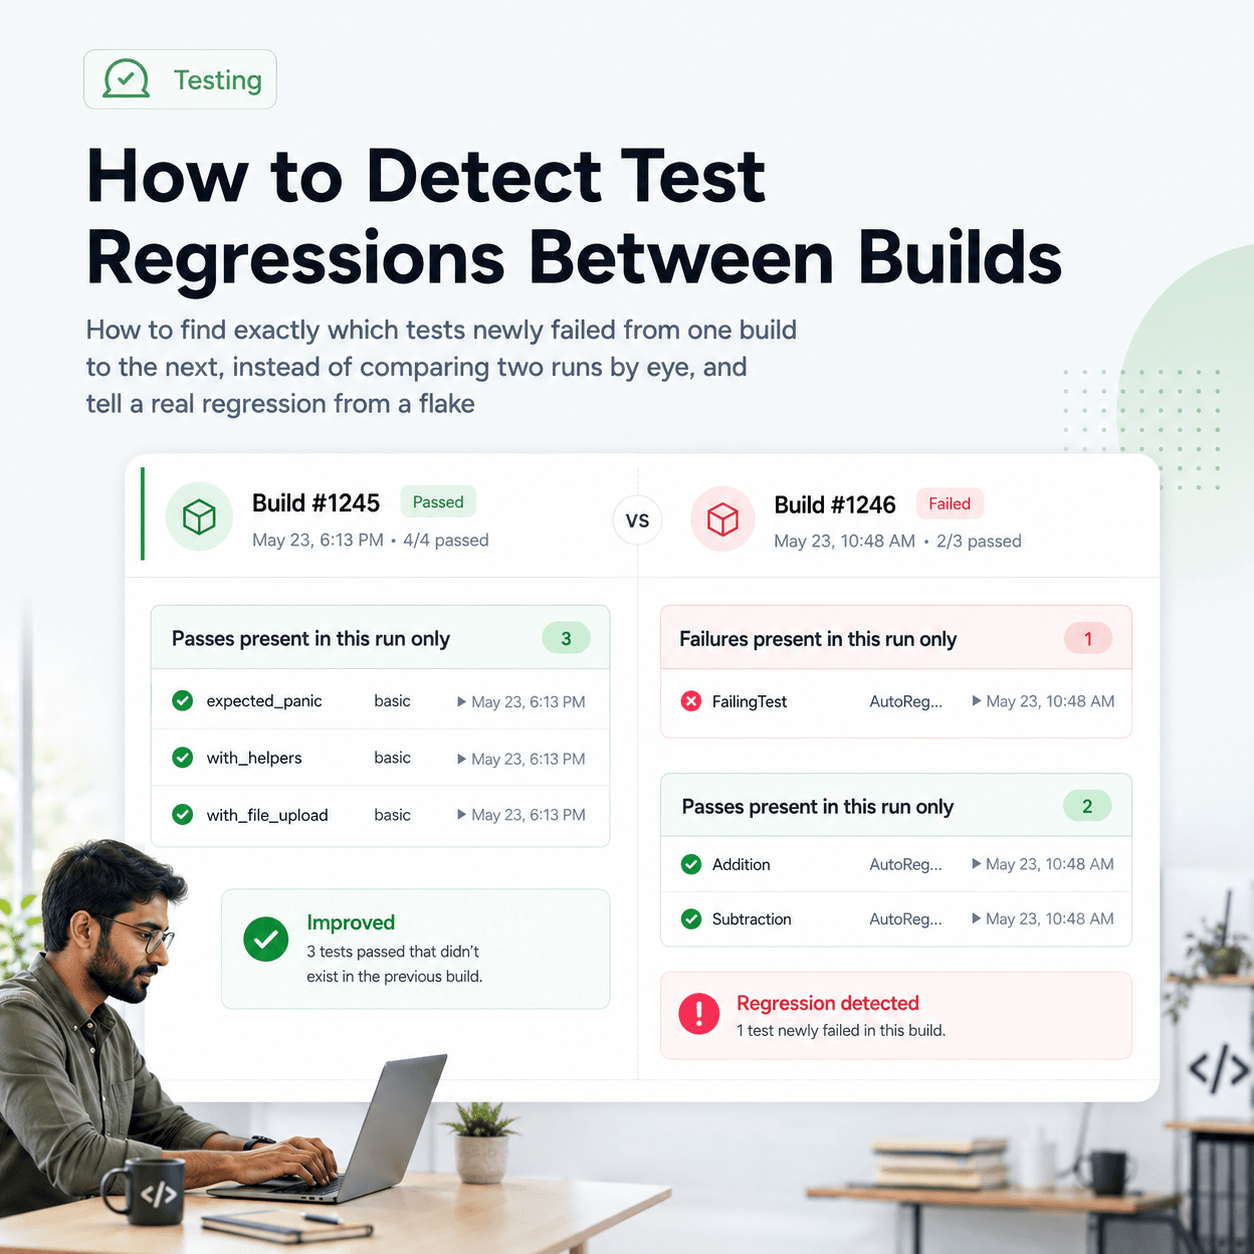
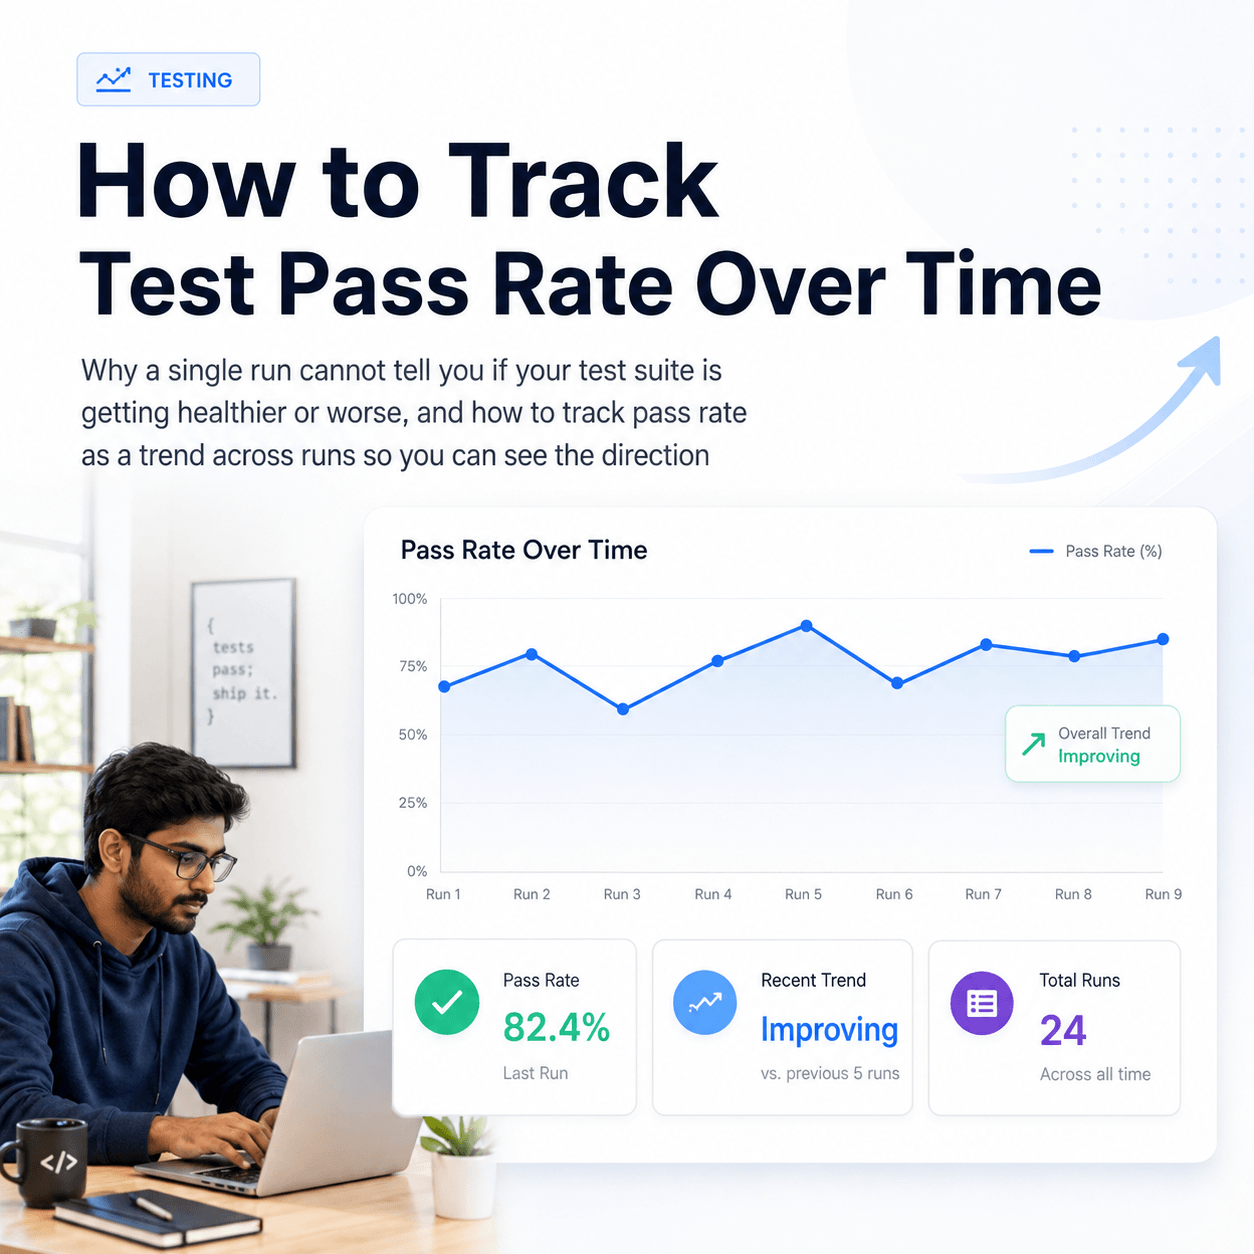
Once each CI run is retained rather than discarded, the run stops being a snapshot and becomes part of a history. You can open the latest run and see which tests just started failing, which just started passing, and which are continuing to fail, and see the pass rate trajectory across recent runs. For a suite that runs on every push, that is the difference between "the build is red" and "these two tests started failing on this build, and this one has been flaky for a week."
Keeping history aligned depends on one habit, especially with parametrized or data driven Playwright tests: keep the suite and test names static and put variable values in the description or a custom field. If the test name changes every run, each run looks like a brand new test and the history does not line up. Your tests stay as dynamic as you like; only the identifier stays fixed:
const { description, custom } = require('playwright-tesults-reporter');

description('checkout applies a discount code');
custom('discount code', code);
The point of viewing Playwright results in CI is not a prettier report. It is removing the download step and adding the one thing a per run report structurally cannot have, memory of the runs before it. Add the reporter, pass the target token from a secret, use a build name so shards consolidate, and every CI run becomes something you open in a browser and compare against history. Full configuration, enhanced reporting, and build options are documented in the Tesults Playwright documentation.