How to Report Vitest Test Results to a Dashboard
Send Vitest results somewhere durable and team-visible, with the setup details specific to Vitest, so multiple test jobs consolidate into one history you can act on
Jul 28, 2026
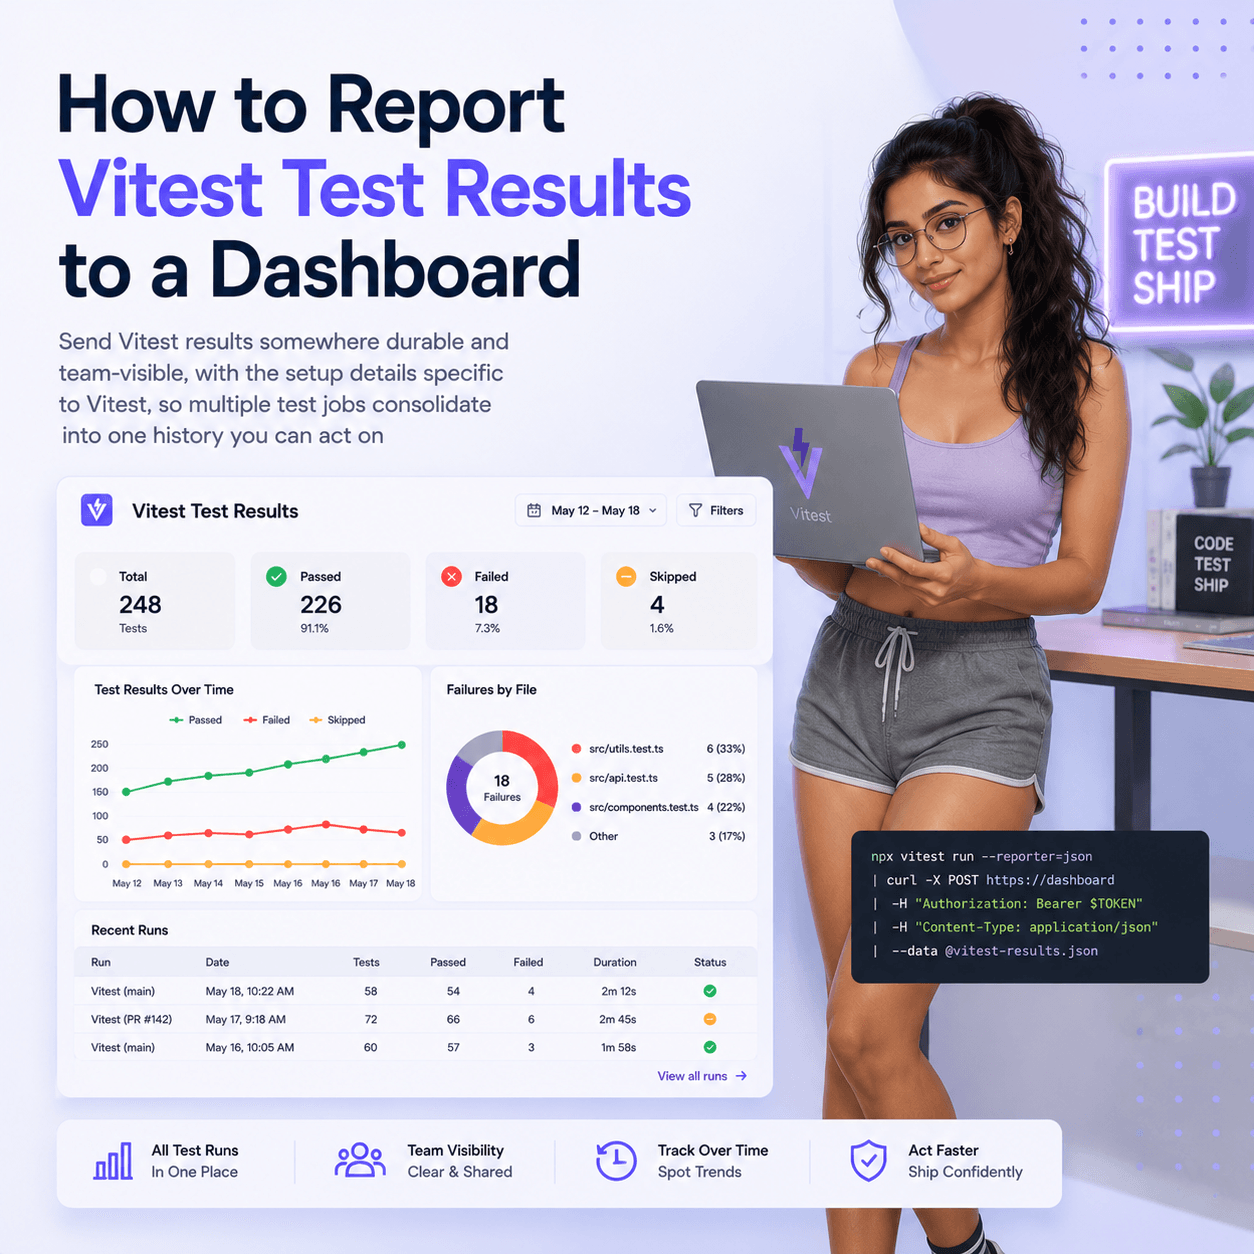
Vitest is fast and its terminal output is good, but that output lives and dies with the run. Once a team has more than one Vitest suite, or more than one person who needs to see results, the console stops being enough. To report Vitest results to a dashboard, add the vitest-tesults-reporter to your Vitest config alongside the default reporter and pass a target token. Each run then pushes to Tesults, where describe blocks become suites and each it becomes a case, retained across runs and consolidated across parallel jobs. This post covers the setup and the two Vitest-specific details that trip people up.
How do you add the reporter?
Install it:
npm install vitest-tesults-reporter --save
Add it to the reporters array in vite.config.js (or vitest.config.js). Note the shape here differs from some other reporters: you pass a new TesultsReporter({...}) instance, not a name-and-options tuple:
import TesultsReporter from 'vitest-tesults-reporter'

export default defineConfig({
  test: {
    globals: true,
    reporters: [
      'default',
      new TesultsReporter({
        'tesults-target': process.env.TESULTS_TARGET || 'token'
      })
    ]
  }
})
Keeping 'default' in the array means you still get Vitest's normal terminal output locally while results also flow to the dashboard. Replace token with your Tesults target token, which you get when creating a project or target and can regenerate from the configuration menu. Reading it from process.env.TESULTS_TARGET as shown is the pattern you want for CI: set the token as a secret in the pipeline and leave it unset locally.
Run Vitest as usual:
npx vitest run
The tesults-target option is what enables upload. If it is not supplied the reporter does not attempt to upload, effectively disabling itself, which is why the env-var pattern above lets the same config stay inert on local machines and active in CI.
How do Vitest tests map to suites and cases?
The reporter treats each describe as a suite and each it (or test) as a case:
describe('SuiteA', () => {
  it("Test1", () => {
    expect(sum(1, 2)).toBe(3);
  });

  it("Test2", () => {
    expect(sum(2, 2)).toBe(4);
  });
});

describe('SuiteB', () => {
  it("Test3", () => {
    expect(sum(3, 3)).toBe(6);
  });
});
Use describe blocks. Tests left outside them arrive ungrouped, and once you have more than a handful of cases, an ungrouped wall is far harder to read on the dashboard than the same cases organised into suites. Grouping is what keeps a large suite navigable.
What is the globals gotcha with enhanced reporting?
Beyond pass and fail, you can attach a description, custom fields, test steps, and files to each case. Import the functions in your test file:
import { description, step, custom, file } from 'vitest-tesults-reporter'The detail specific to Vitest: enhanced reporting requires globals: true in your Vitest config. The reporter uses the global test context to detect which test is calling these functions, and without globals enabled it cannot, so the calls will not attach correctly. If your project runs with globals off, this is the thing to change before expecting descriptions or steps to appear. Once globals is on, call the functions from inside an it block:
import { describe, it, expect } from 'vitest'
import { description, step, custom, file } from 'vitest-tesults-reporter'

describe('Suite A', () => {
  it('Test 1', () => {
    description("description here")

    step({name: "step 1", desc: "step 1 description", result: "pass"})
    step({name: "step 2", desc: "step 2 description", result: "fail", reason: "assert failed"})

    custom("priority", "high")

    file("/full/path/screenshots/screenshot.png")

    expect(sum(1, 2)).toBe(3)
  });
});
Steps are the field that most changes what a failure looks like: instead of a case that simply failed, you get the sequence that led there with the failing step and a reason. On files, one caution from the docs: upload time depends on your network speed and the upload blocks at the end of the run, so attach a reasonable number of files per case, and when first integrating, get results flowing without files to confirm the setup before adding them.
How do you consolidate parallel runs into one result?
This is the detail that matters most once you are past a single suite, and it is exactly where teams running several Vitest jobs get a fragmented dashboard. Vitest runs fast and teams often shard suites across parallel CI jobs; each job submits separately, and Tesults treats each submission as its own run by default. Four shards become four runs.
Give every submission for the same logical run a shared build name, then enable Build Consolidation from the configuration menu. Submissions sharing a build name merge into a single run automatically, whenever each finishes:
new TesultsReporter({
  'tesults-target': process.env.TESULTS_TARGET || 'token',
  'tesults-build-name': process.env.BUILD_ID || '1.0.0'
})
If there is no natural version to use, a timestamp captured when the run starts works as the shared identifier. You can also report tesults-build-result, tesults-build-desc, and tesults-build-reason to record what the build was and why it failed, which is context worth having when looking back at a run later.
What do you get once runs accumulate?
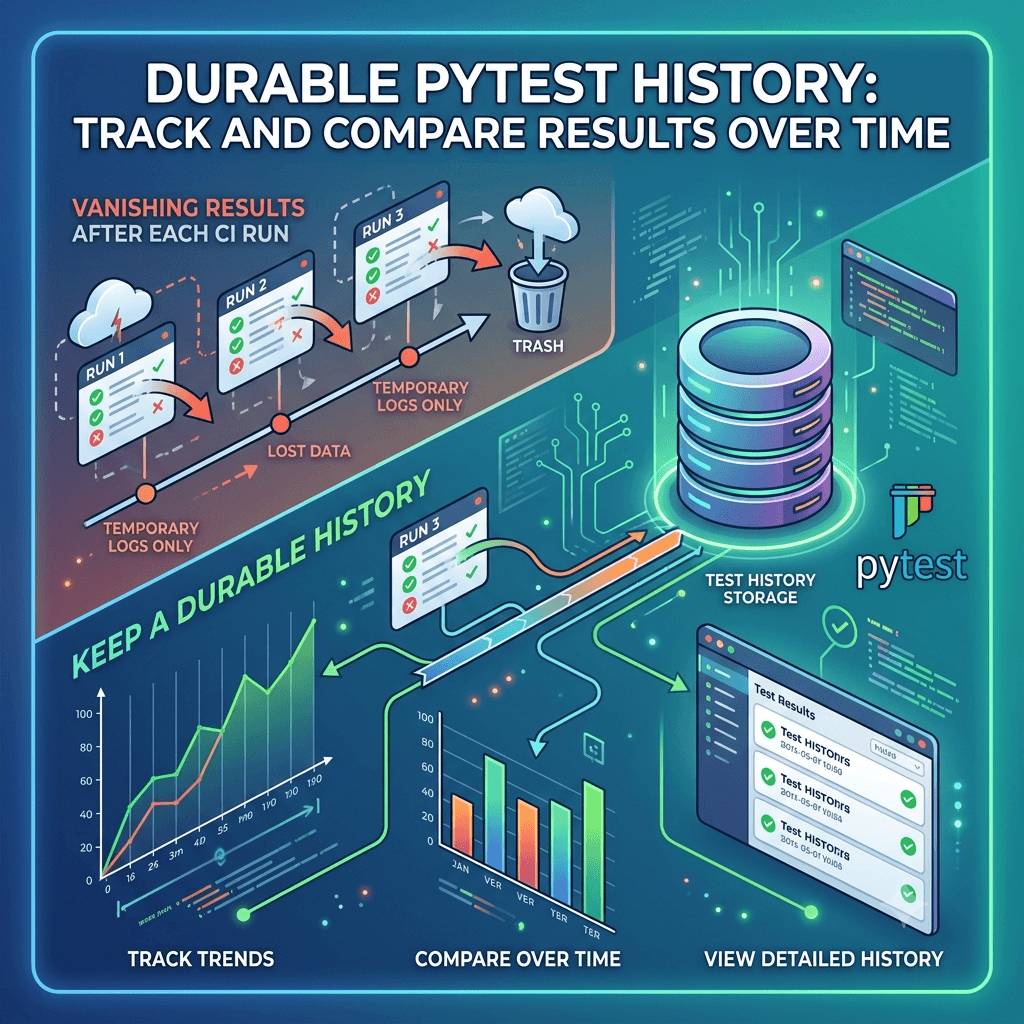
The reason to report rather than just read is what exists after several runs. Each test carries a history, so you can see which cases just started failing, which just started passing, which have been failing continuously, and how pass rate is trending, none of which a single terminal run can tell you. For a suite that runs on every push across several jobs, that is the difference between "CI is red somewhere" and "these two cases started failing on this build, and this one has been flaky for a week."
Keeping that history aligned depends on one habit, and it matters most with the parametrized and data-driven tests common in Vitest suites. Tesults matches cases across runs by suite and test name, so keep those names static and put variable values in the description or a custom field. If the name changes every run, each run looks like a new set of tests and nothing lines up, which also breaks failure assignment:
describe('Checkout', () => {
  it('applies discount code', () => {
    custom("discount code", code)
    expect(applyDiscount(code)).toBe(expected)
  });
});
Your tests stay as dynamic as you like. Only the identifier stays fixed.
The whole change is one install and a few lines in your Vitest config, and it leaves how you write and run tests untouched. What you get back is results that outlive the terminal, are visible to people who did not run the suite, and consolidate across parallel jobs into one history you can actually ask questions of. Full configuration, enhanced reporting, and build options are documented in the Tesults Vitest documentation.