How to Report Jest Test Results to a Dashboard
How to send Jest results somewhere they are kept, viewable by the team, and comparable across runs, without giving up the default reporter
Jul 22, 2026

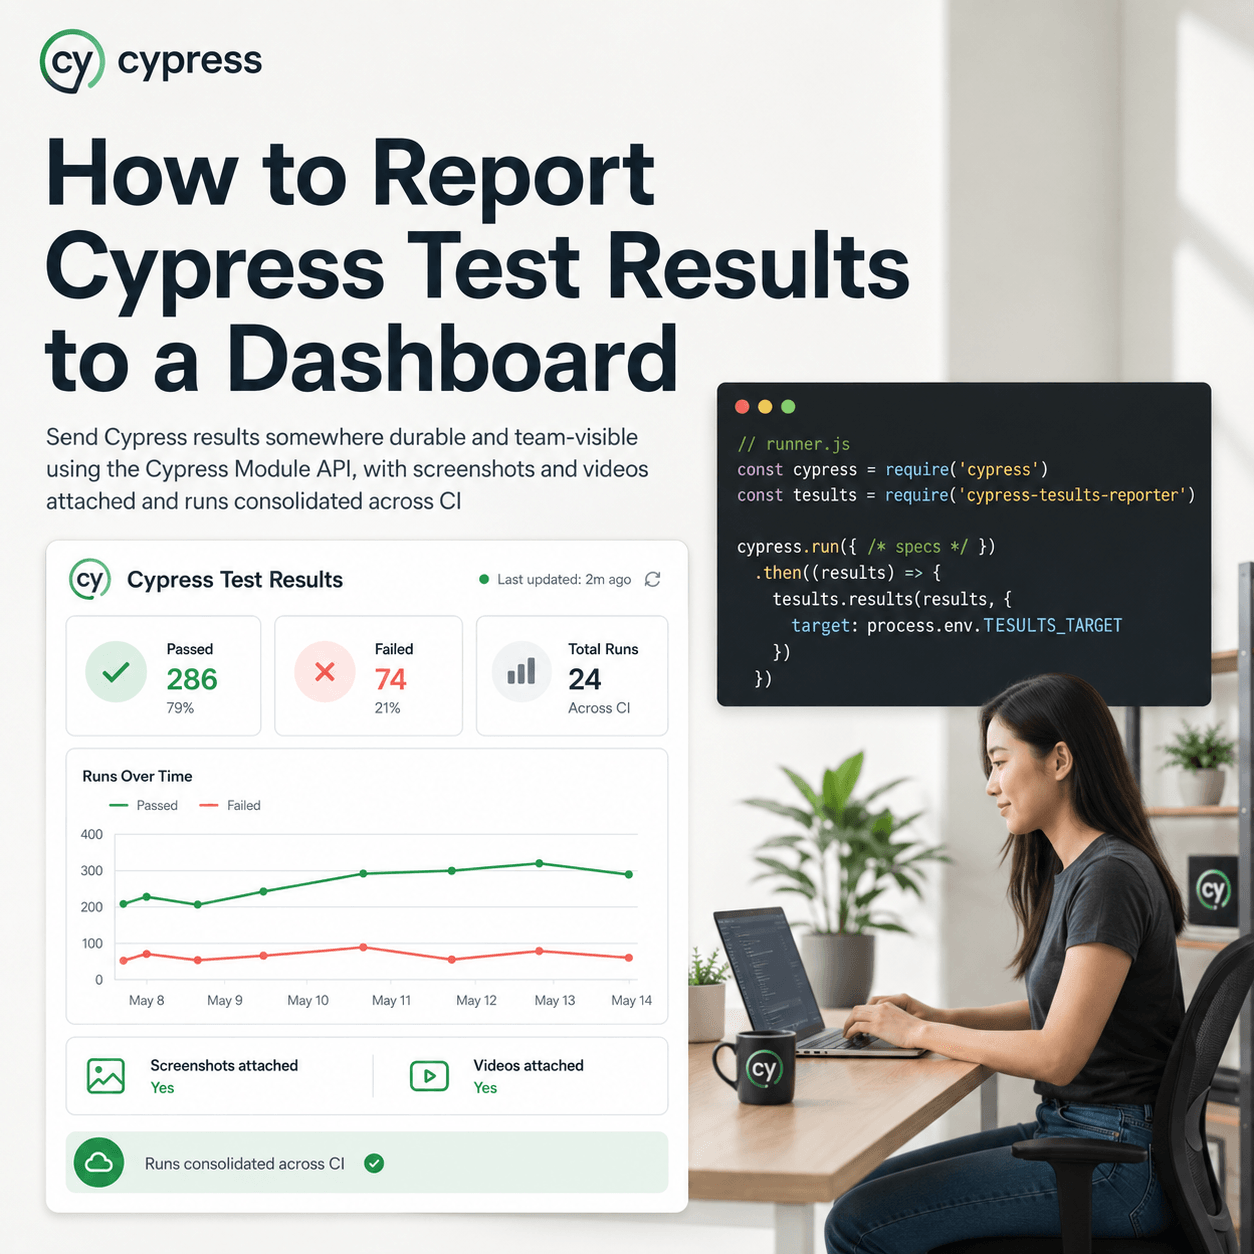
Jest prints results to the terminal and forgets them. That is fine while you are working locally, but it means nobody else can see a run, and there is no way to compare today's results to last week's. To report Jest results to a dashboard, add the jest-tesults-reporter alongside Jest's default reporter and pass a target token. Every run then pushes its results to Tesults, where describe blocks become test suites and each test becomes a test case, retained across runs so the team can open them and so history accumulates. Nothing about how you write or run your tests changes.
How do you add the reporter?
Install it:
npm install jest-tesults-reporter --save
Then add it to the reporters array in your Jest configuration, whether that lives in package.json, in jest.config.js, or in a file you point at with the --config option:
"jest": {
  "reporters": [
    "default",
    ["jest-tesults-reporter", {"tesults-target": "token"}]
  ]
}
Keeping "default" in the array matters. The Tesults reporter is added next to Jest's own, not in place of it, so you still get the terminal output you are used to while running locally. Replace token with your Tesults target token, which you receive when creating a project or target and can regenerate from the configuration menu.
Now run Jest exactly as before:
npm test
That is the integration. The tesults-target argument is what enables the upload, and if it is not supplied the reporter does not attempt to upload at all, which effectively disables it. That is a useful property: the same configuration can sit in your repo and stay inert until a token is present, so you can supply it only in CI through an environment variable and keep local runs from pushing results.
How do Jest tests map to suites and cases?
The reporter treats each describe as a test suite and each test (or it) as a test case:
describe('SuiteA', () => {
  test("Test1", () => {
    expect(sum(1, 2)).toBe(3);
  });

  test("Test2", () => {
    expect(sum(2, 2)).toBe(4);
  });
});

describe('SuiteB', () => {
  test("Test3", () => {
    expect(sum(3, 3)).toBe(6);
  });
});
This is worth knowing before your first run rather than after. If your tests are not wrapped in describe blocks, everything arrives ungrouped, and a few hundred flat test cases is a much worse thing to read than the same cases organised into suites. Using describe is the recommended approach specifically so cases group properly in the dashboard.
Is that Jest warning after the run a problem?
Once the reporter is uploading, you may see this from Jest:
Jest did not exit one second after the test run has completed. This usually means that there are asynchronous operations that weren't stopped in your tests. Consider running Jest with `--detectOpenHandles` to troubleshoot this issue.
You can safely ignore it. Sending results to Tesults takes longer than one second, particularly when files are involved, and Jest emits this warning whenever anything is still working after the tests themselves finish. It is not a sign of a leak in your tests or a misconfigured reporter. Worth knowing, because the natural reaction is to start chasing open handles that are not there.
What else can you attach to a test case?
Beyond pass and fail, the reporter lets you enrich each case. Require it in your test file:
const tesultsReporter = require("./node_modules/jest-tesults-reporter/tesults-reporter.js")Then call its functions from inside a test block. The first parameter is always expect.getState(), which gives the reporter the context of which test is calling:
tesultsReporter.description(expect.getState(), "some description here")
tesultsReporter.custom(expect.getState(), "Some custom field", "Some custom value")
tesultsReporter.file(expect.getState(), "/absolute/path/to/file/screenshot.png")
The one that most changes what a failure looks like is step. Instead of a case that simply failed, you get the sequence that led there, with the point of failure and a reason:
tesultsReporter.step(expect.getState(), {
  name: "First step",
  result: "pass"
})
tesultsReporter.step(expect.getState(), {
  name: "Second step",
  description: "Second step description",
  result: "fail",
  reason: "Error line 203 of test.js"
})
For a long test where the assertion that failed is not the interesting part, this is the difference between a red case and a case that explains itself. On files, one caution from the docs: upload time depends entirely on your network speed, and the upload blocks at the end of the run. Attach a reasonable number of files per case, and when first setting up, get results flowing without files so you can confirm the integration separately from upload volume.
How do you avoid fragmenting runs across parallel jobs?
If you split your Jest suite across several CI machines, each one submits its results separately, and the default behavior on Tesults is to treat every submission as its own test run. A suite split four ways becomes four runs, which is not what you want to look at.
Give each submission for the same logical run a shared build name, then enable Build Consolidation from the configuration menu. Submissions sharing a build name are merged into a single test run automatically, whenever each one finishes:
"jest": {
  "reporters": [
    "default",
    ["jest-tesults-reporter", {
      "tesults-target": "token",
      "tesults-build-name": "1.0.0"
    }]
  ]
}
If there is no natural version to use, a timestamp captured when the run starts works as the shared identifier. You can also report tesults-build-result, tesults-build-desc, and tesults-build-reason to record what the build was and why it failed, which is useful context when looking back at a run later.
What do you get once runs accumulate?
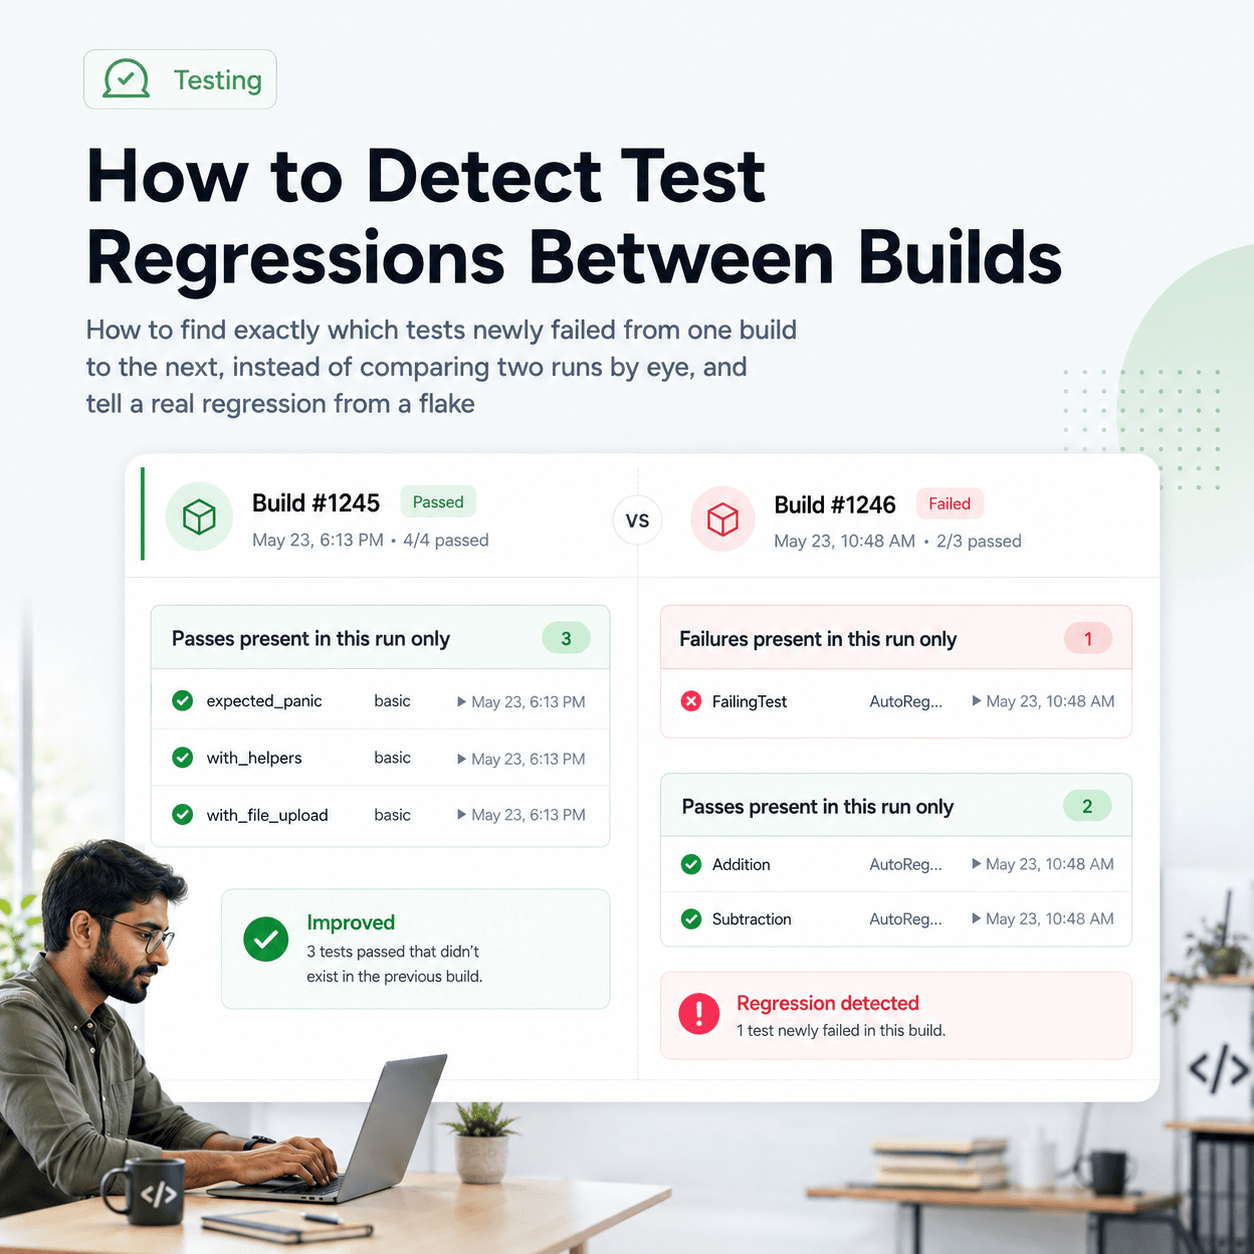
The reason to report results rather than just read them is what becomes possible after several runs exist. Each test carries a history rather than a single outcome, so you can see which cases just started failing, which just started passing, which have been failing continuously, and how pass rate is trending. None of that is answerable from terminal output, however carefully you read it.
Getting there depends on one habit. Tesults matches test cases across runs by suite and test name, so those names need to stay stable. If you generate test names from variable data, every run looks like a fresh set of tests and no history lines up, which also breaks failure assignment. Keep the describe and test names static and put the variable values in a description or custom field instead:
describe('Checkout', () => {
  test('applies discount code', () => {
    tesultsReporter.custom(expect.getState(), "discount code", code)
    expect(applyDiscount(code)).toBe(expected)
  });
});
Your tests stay exactly as dynamic as they were. Only the identifier stays fixed.
The whole change is one npm install and one entry in your reporters array, and it does not disturb anything about how you write or run Jest. What you get back is results that outlive the terminal, are viewable by people who did not run the suite, and accumulate into a history you can ask questions of. Full configuration, enhanced reporting functions, and build options are documented in the Tesults Jest documentation.