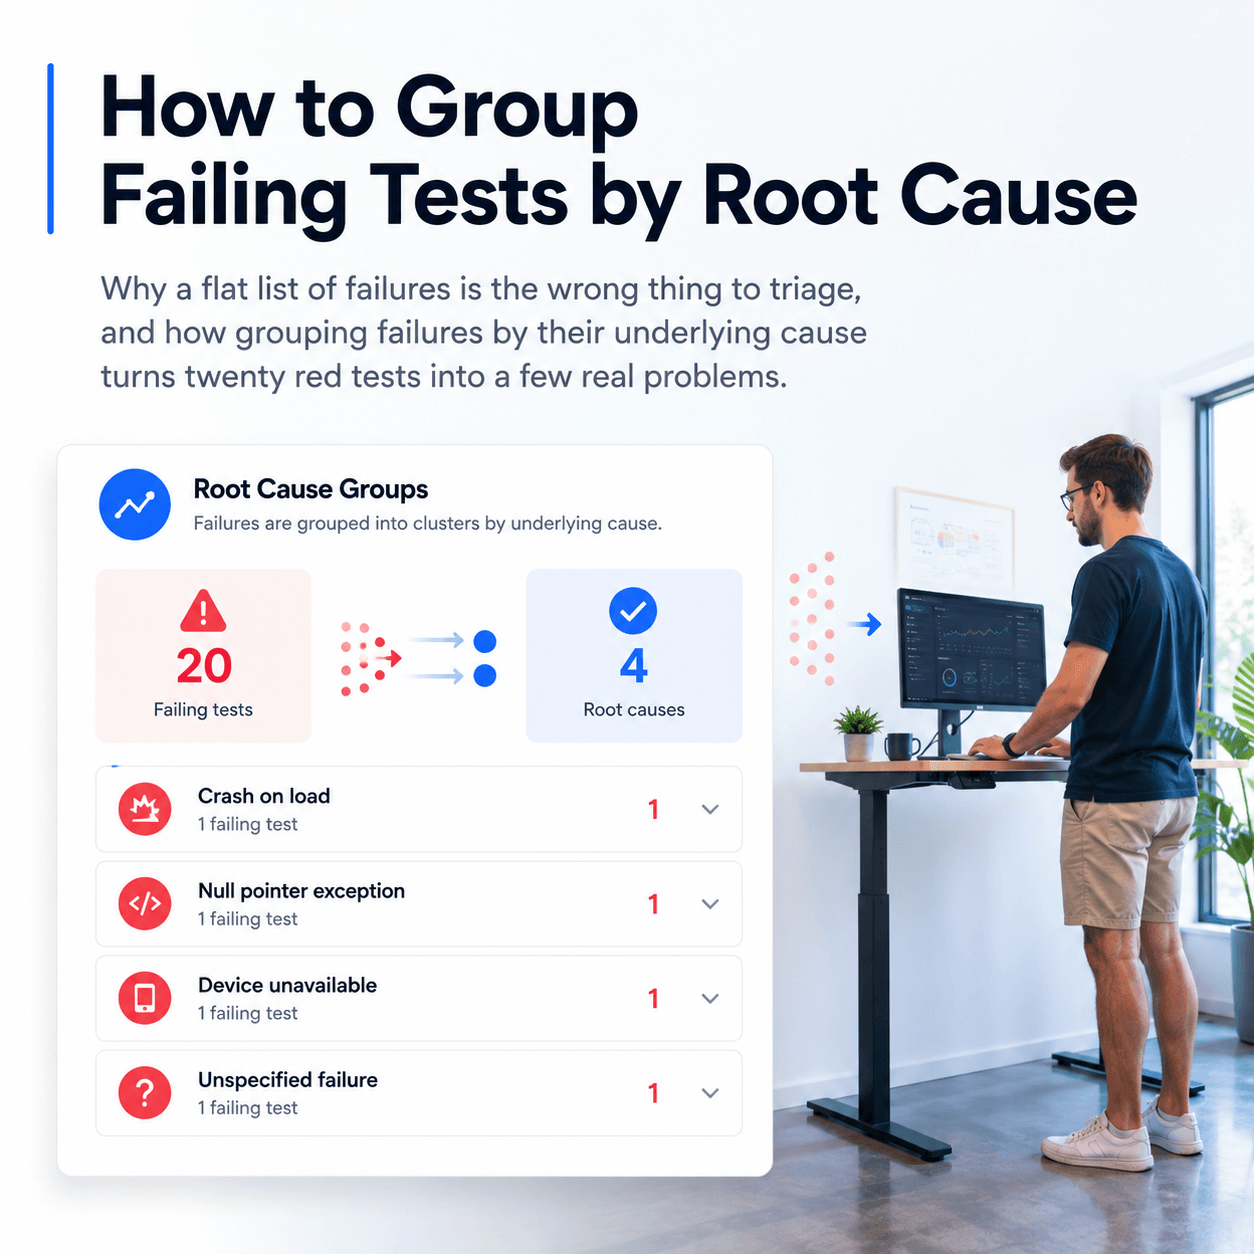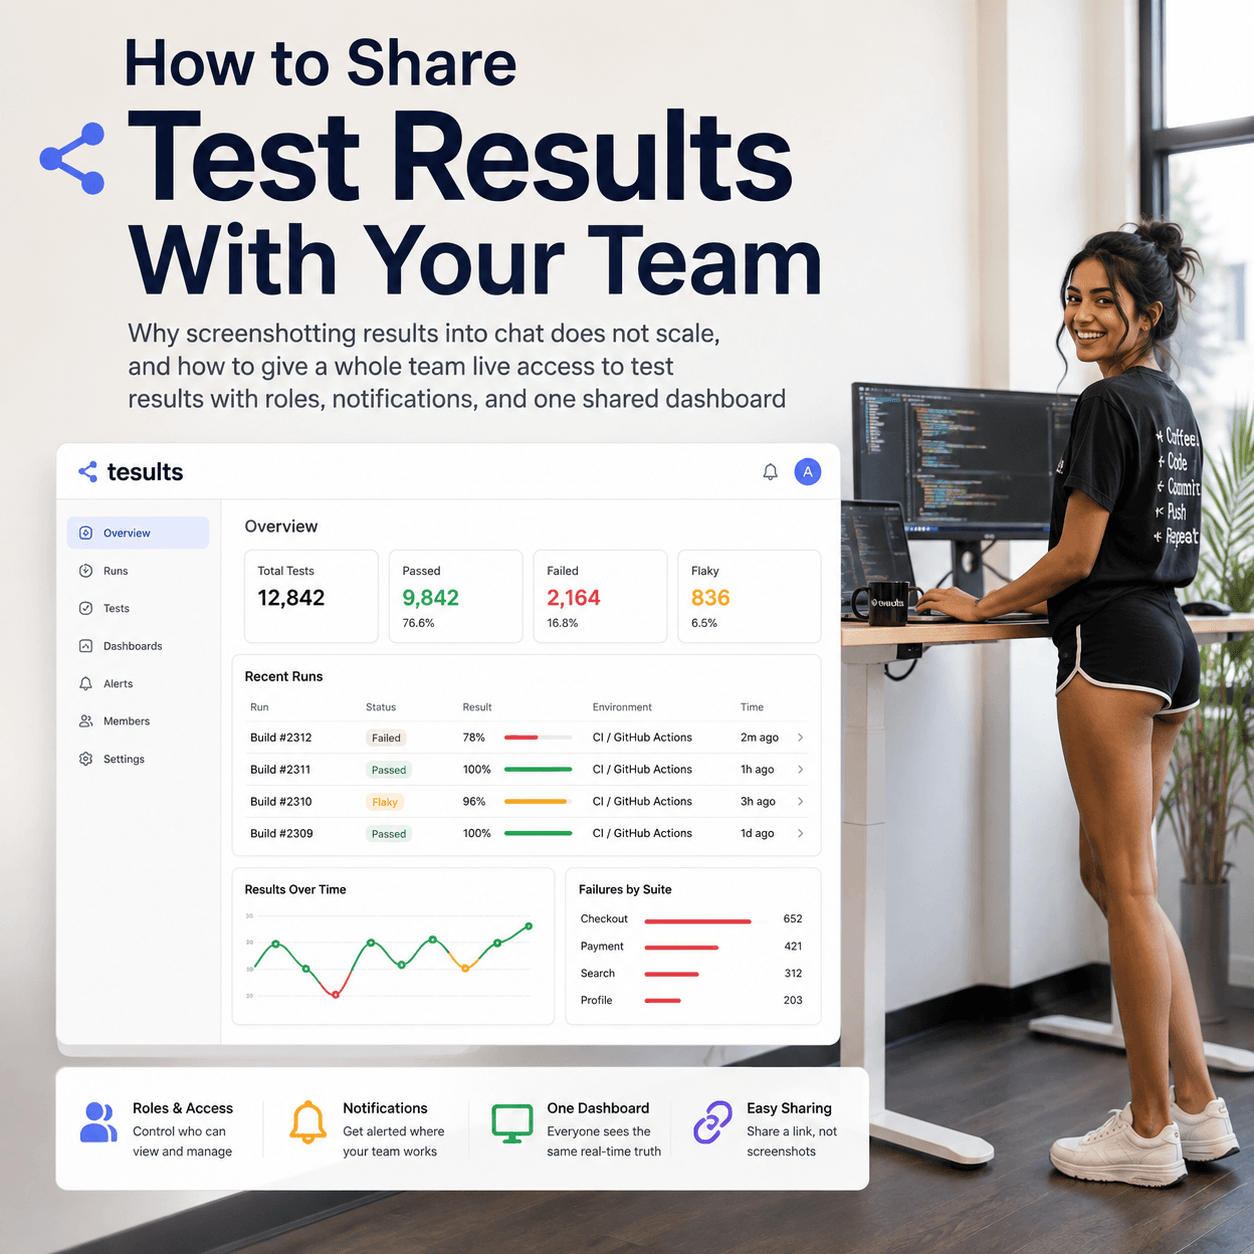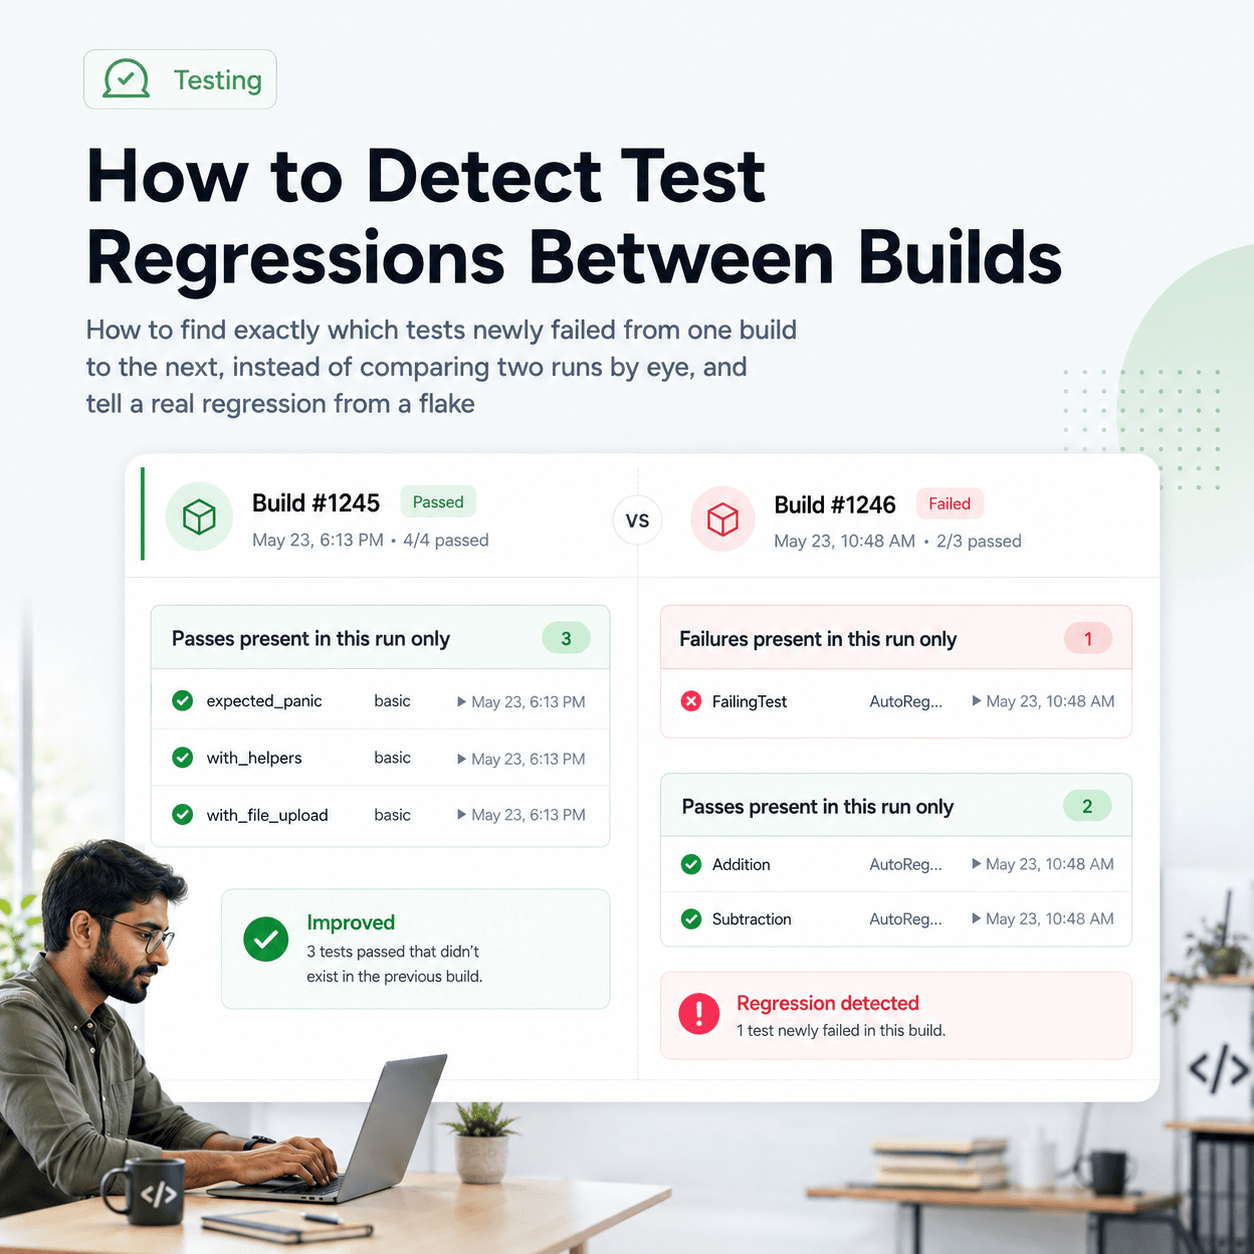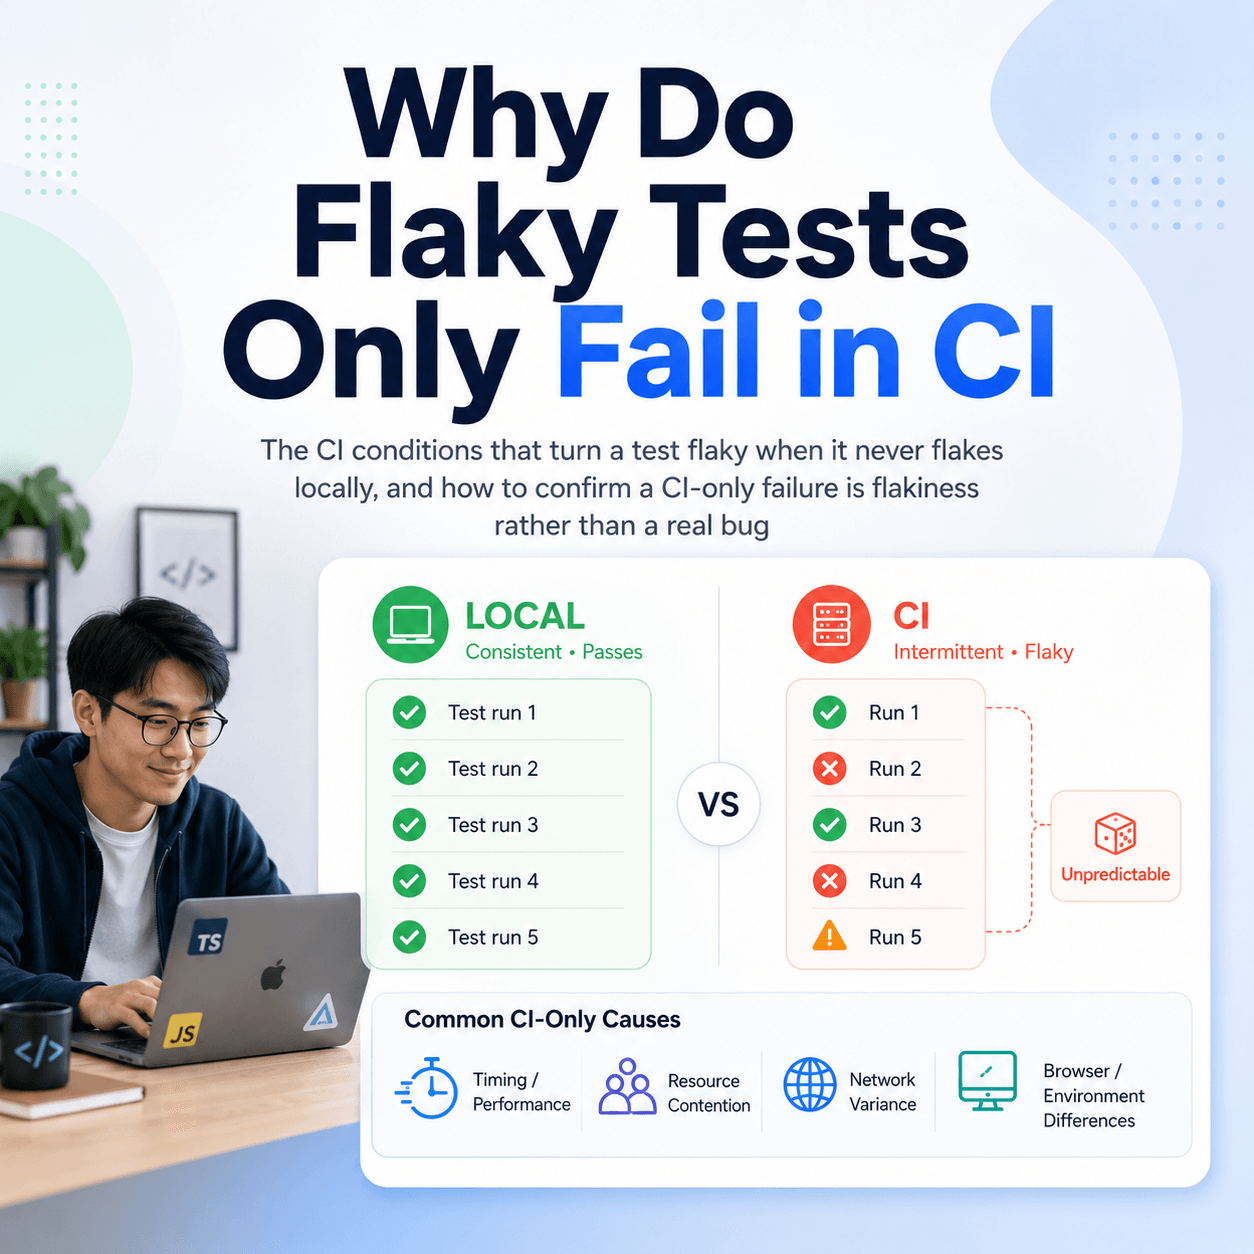
The Tesults web app is designed for desktop browsers. Sign up and configure your project on a laptop or desktop. Use the iOS app or Android app to view results on the go.

No case pricing

Number of cases no longer a consideration for pricing

blog-title-image

We are excited to announce that the number of cases per test run is no longer a consideration for pricing. To make this possible Tesults has undergone a massive back-end restructuring to completely change the way we process and store results data.

With the previous system architecture it simply wasn’t possible to take cases out of consideration but it was never something we were happy with. Software development teams should not need to think about how many test cases they have in a single test run for reporting. In addition, it made keeping the Tesults mission around consolidating results from several source targets difficult to achieve for projects with higher numbers of test cases.

While our team was busy implementing this change we decided to do other awesome things too:

  • Rate Limits: Previously the rate limiting applied at 5 results api calls per 15 minute period. From now on all new plans reduce this period to only 5 minutes.
  • Data: We offer far more data now per target than was previously provided by default. You can still increase this manually but we suggest leaving it at the minimum amount unless Tesults shows you are reaching plan limits on the results page.
  • Case Limits: As mentioned, you no longer have to decide on the maximum number of test cases you will be uploading on each test run. There is a default cap in place of 10,000 but we are happy to increase this if you get in contact with us and ask for an increase.
  • Simpler pricing: default pricing (applied if you do not change data settings) makes pricing so much simpler. From now on all new plans charge $25 per target. That’s it! All you really have to think about now is how many targets your project and team needs. This target price includes 25 team members and 30 days history. Each additional 25 team members is only $5 extra per target. These prices are for a monthly rate if paying annually. Check out the new pricing page for more details.

Existing customers will remain on their existing plans unless they choose to change to new plans based on the new pricing. Changing is easy to do from the configuration menu and you can change plans at any time. We will be sending emails to project owners and officers to make them aware of the pricing change. Take a look at the new pricing page and if you would incur a higher charge we suggest you remain on your current plan. For customers who would make significant savings you can either take advantage of these savings or you can get far greater value from Tesults by getting more targets at the same rate.

We are super excited with this change, it makes us happy that teams no longer have to think about how many test cases they have when using Tesults and we think this makes Tesults far better positioned to offer massive value with respect to results consolidation from several targets.


- Tesults Team

Test automation reporting and failure intelligence

Consolidated test reporting for engineering teams. Store, track, and understand test results across every run and system.

Latest Posts

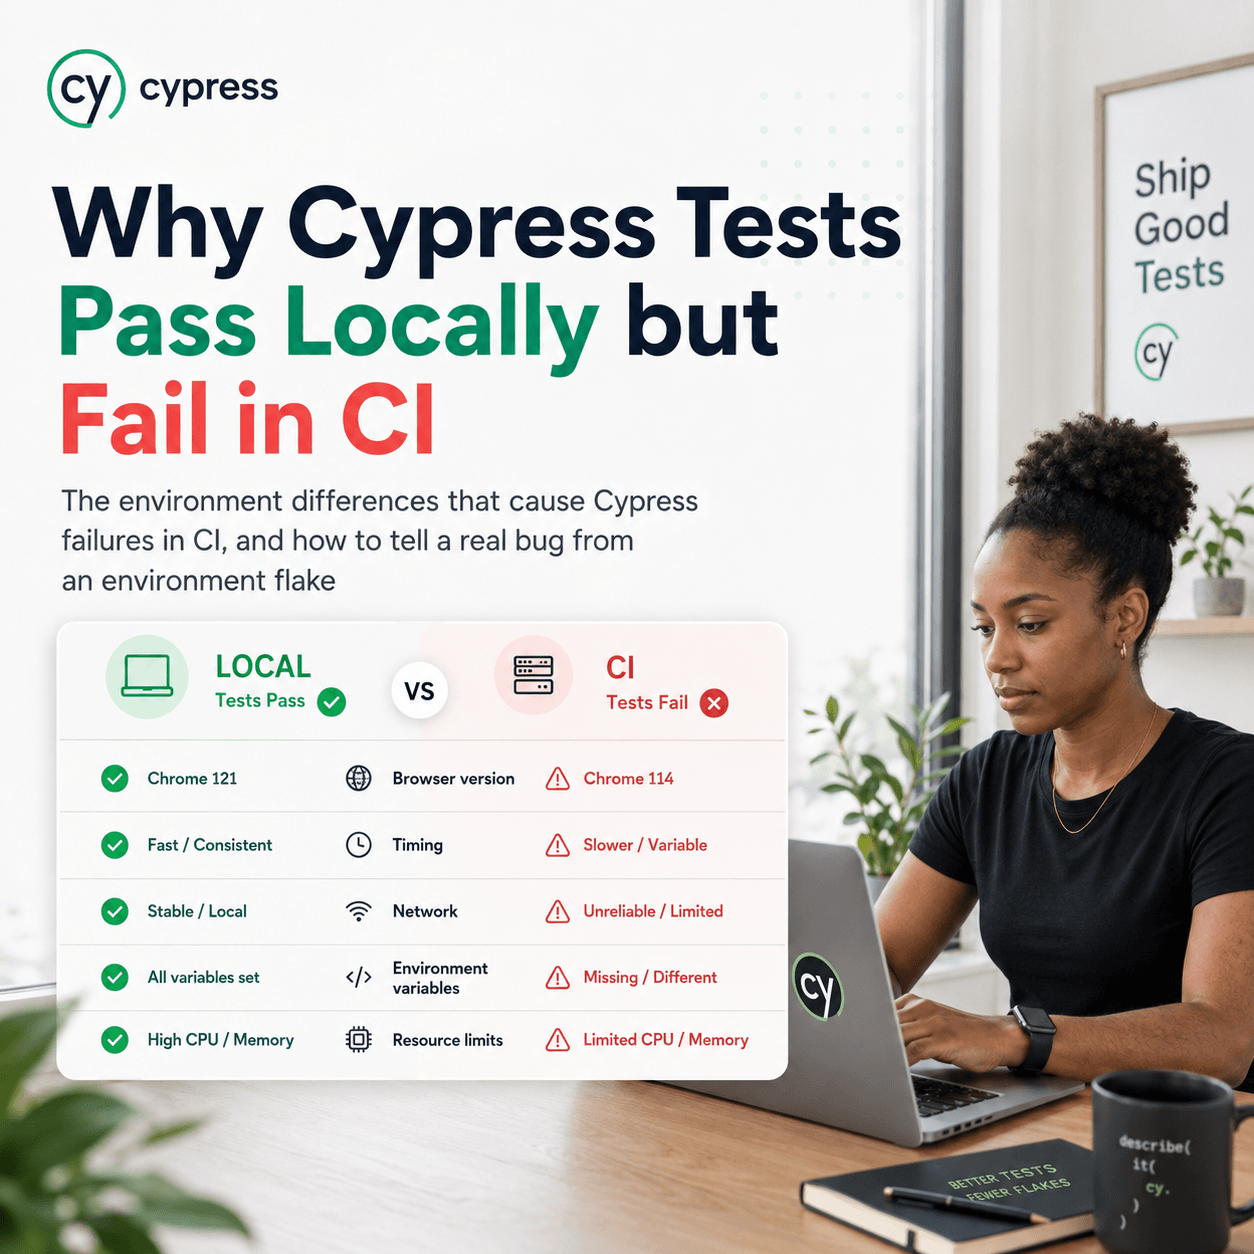
Why Cypress Tests Pass Locally but Fail in CI
The environment differences that cause Cypress failures in CI, and how to tell a real bug from an environment flake
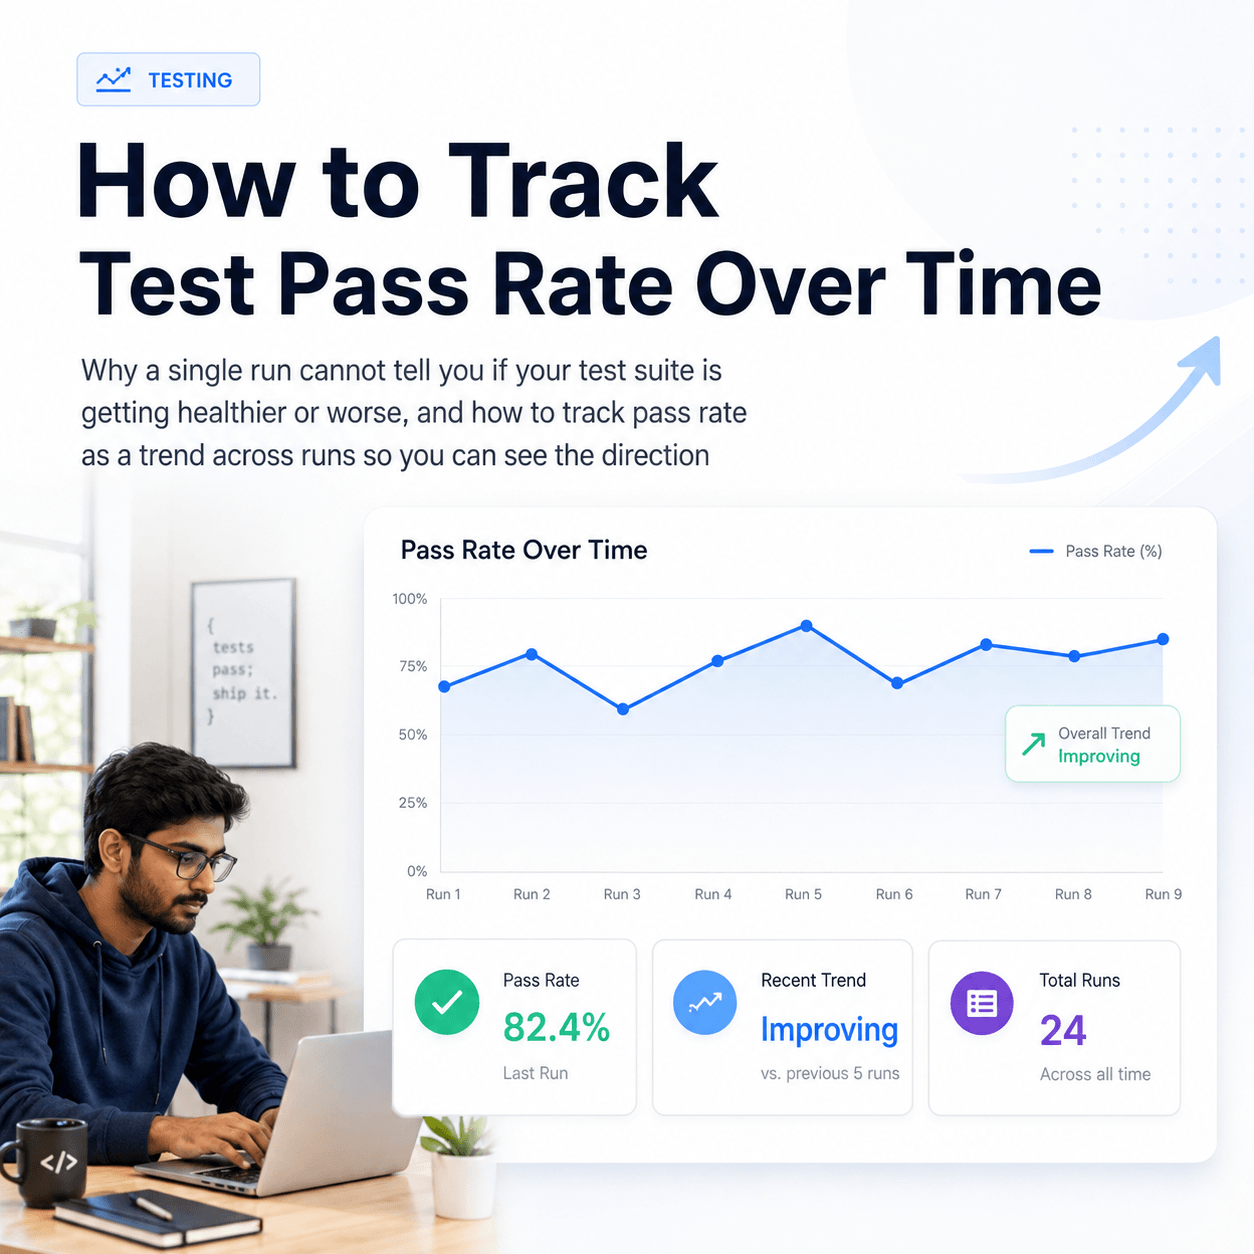
How to Track Test Pass Rate Over Time
Why a single run cannot tell you if your test suite is getting healthier or worse, and how to track pass rate as a trend across runs so you can see the direction
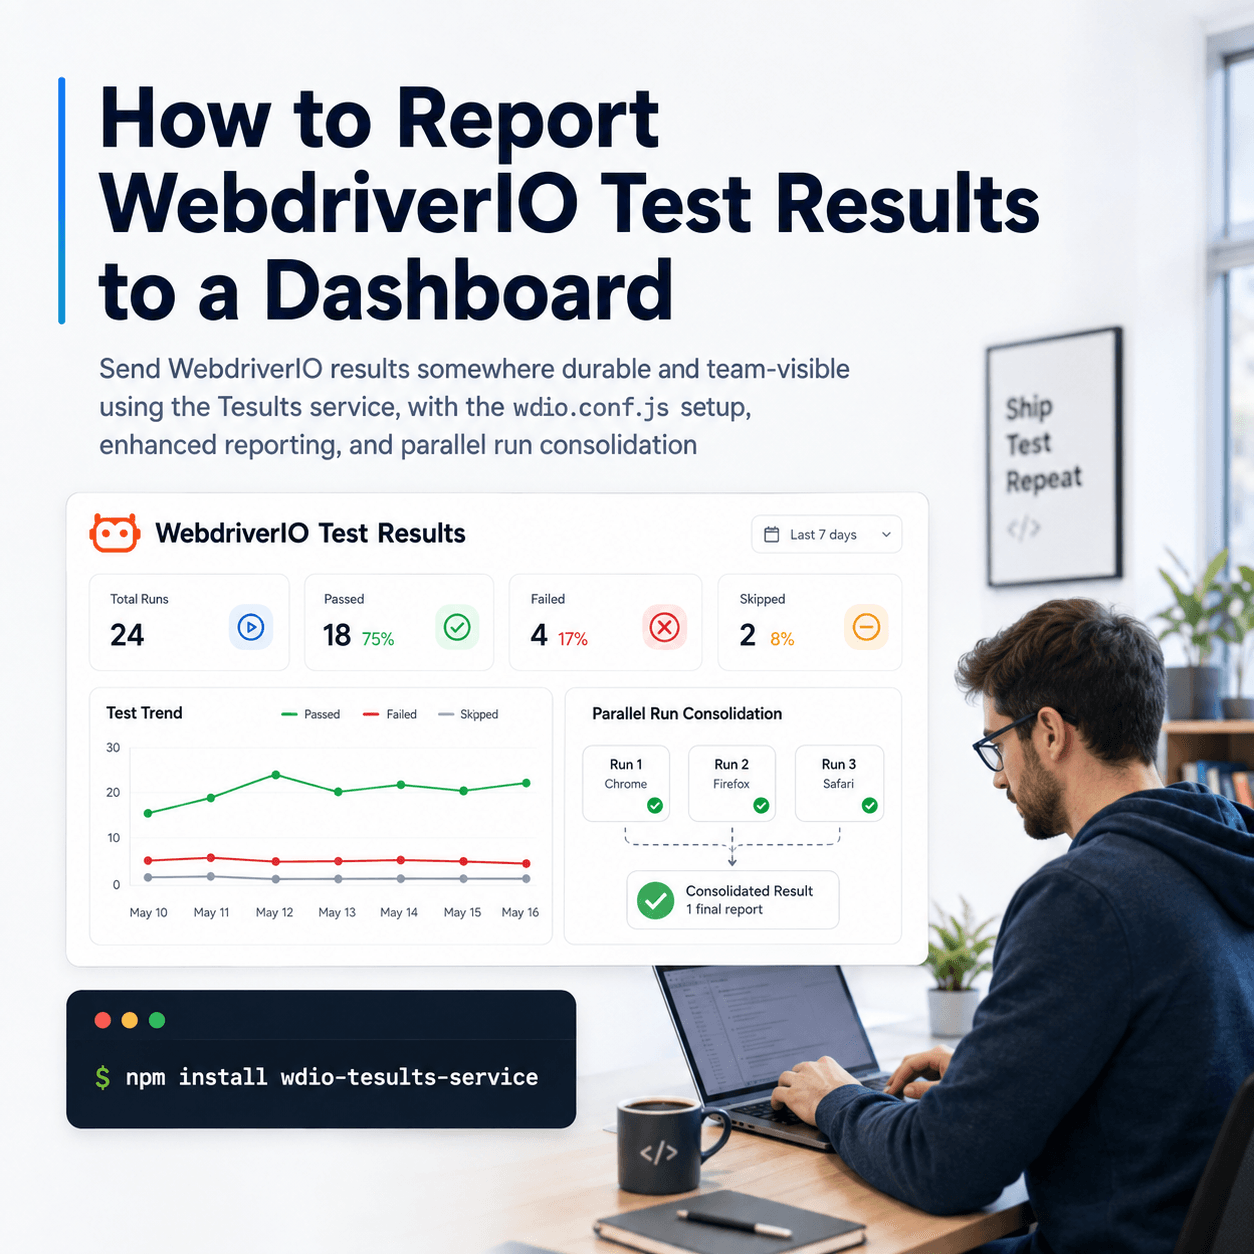
How to Report WebdriverIO Test Results to a Dashboard
Send WebdriverIO results somewhere durable and team-visible using the Tesults service, with the wdio.conf.js setup, enhanced reporting, and parallel run consolidation
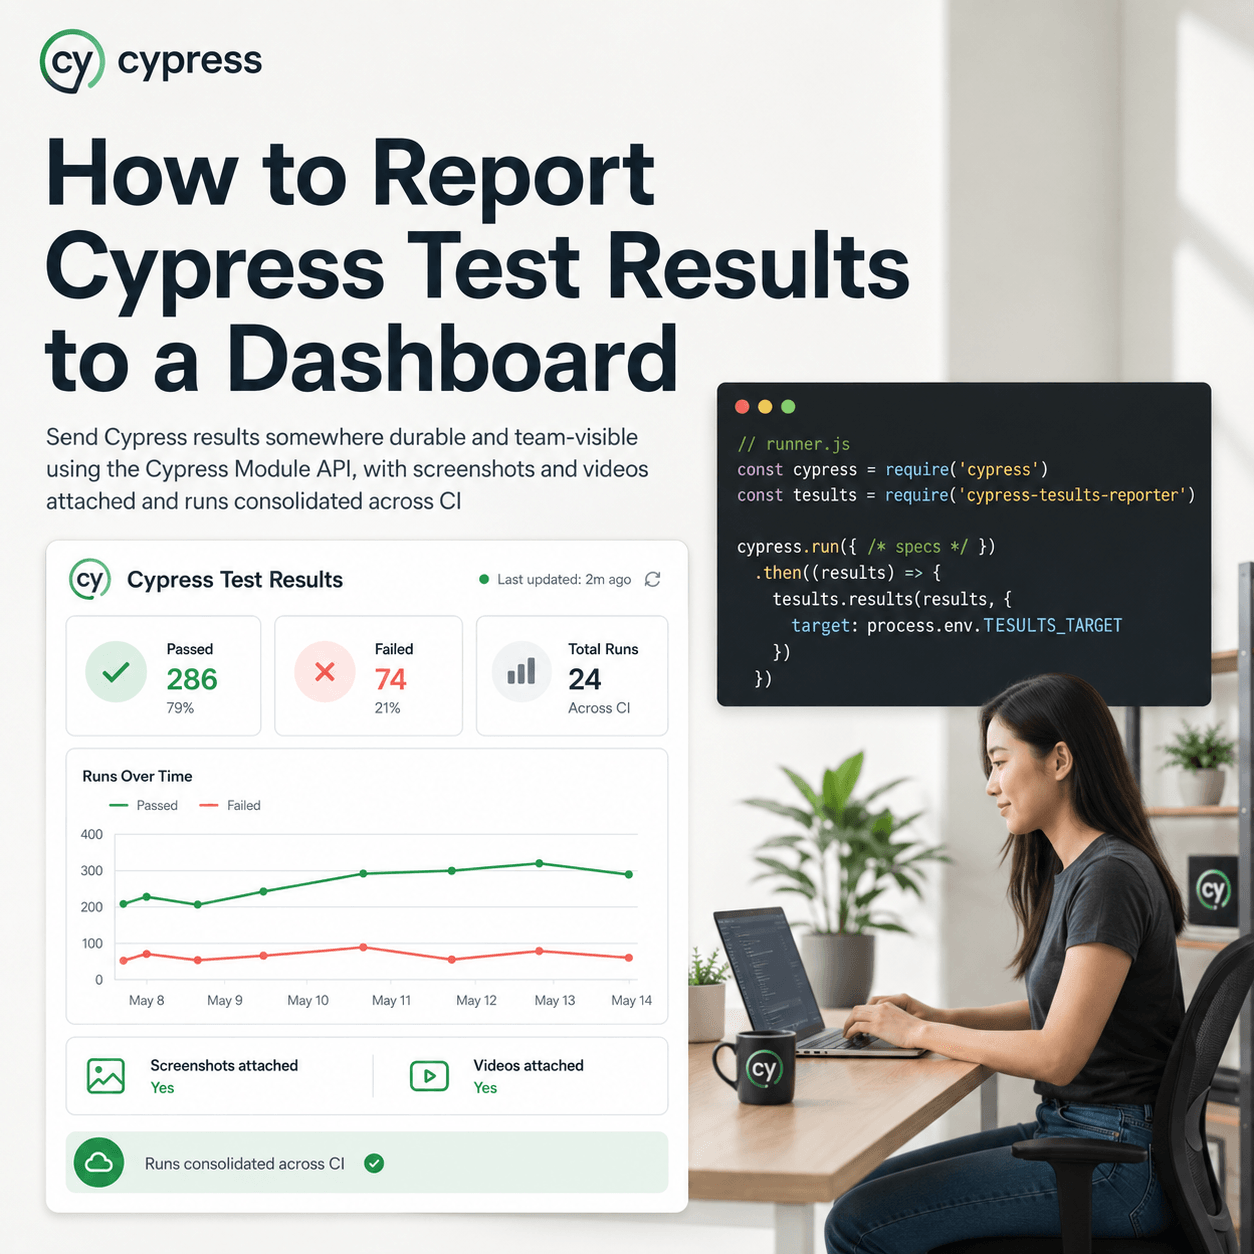
How to Report Cypress Test Results to a Dashboard
Send Cypress results somewhere durable and team-visible using the Cypress Module API, with screenshots and videos attached and runs consolidated across CI
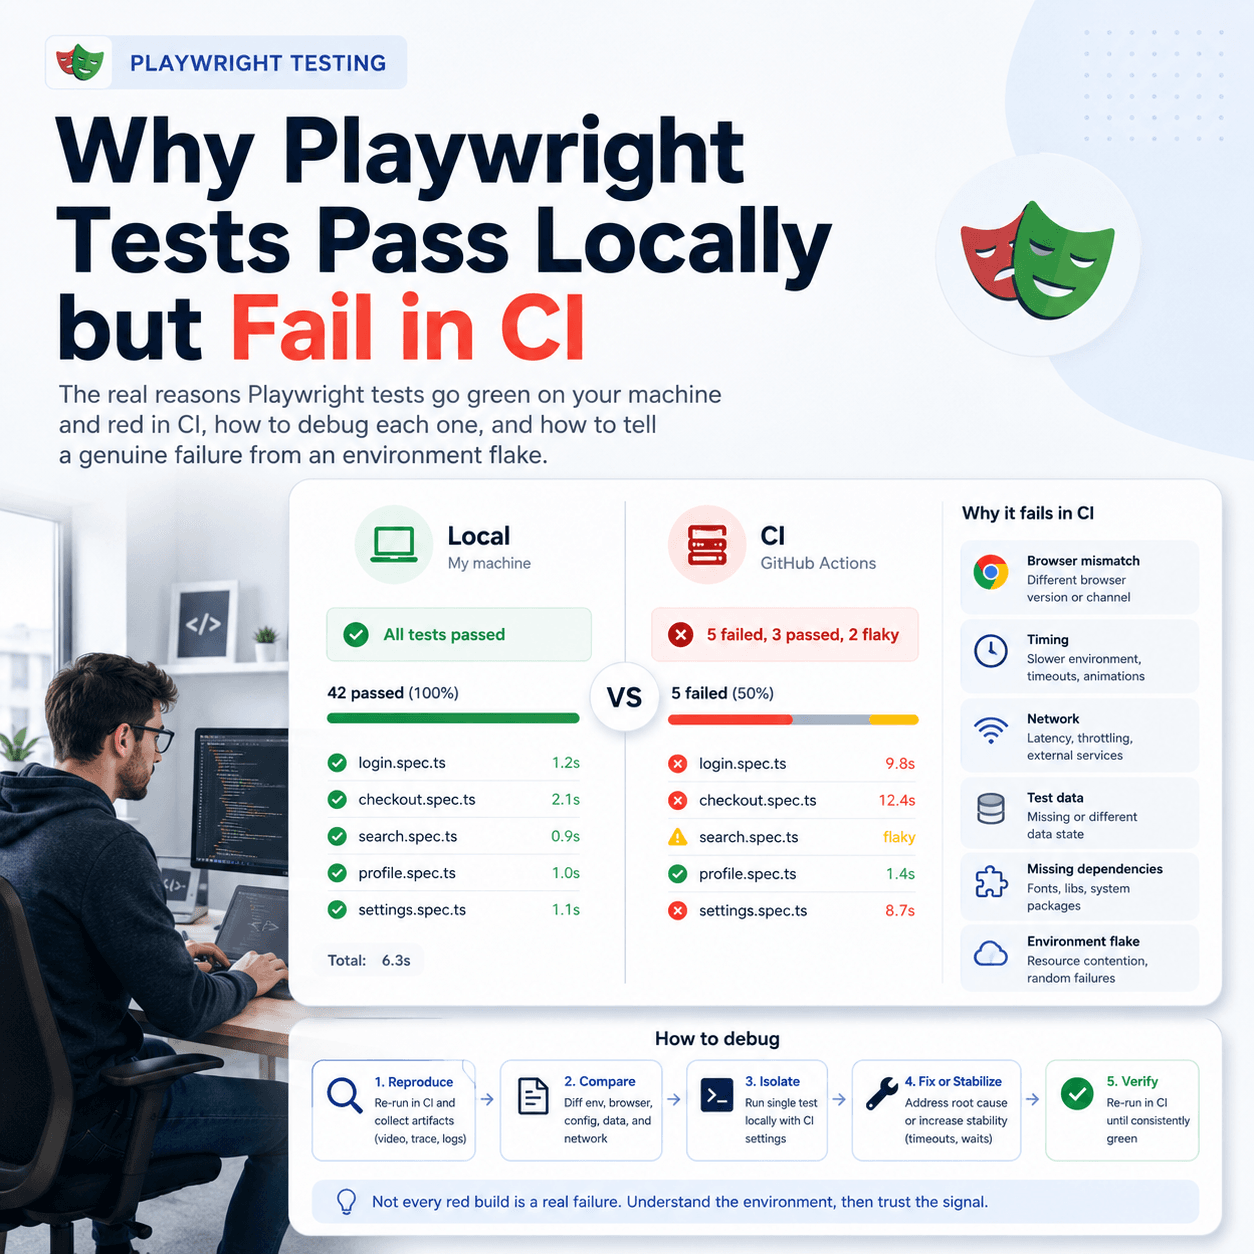
Why Playwright Tests Pass Locally but Fail in CI
The real reasons Playwright tests go green on your machine and red in CI, how to debug each one, and how to tell a genuine failure from an environment flake
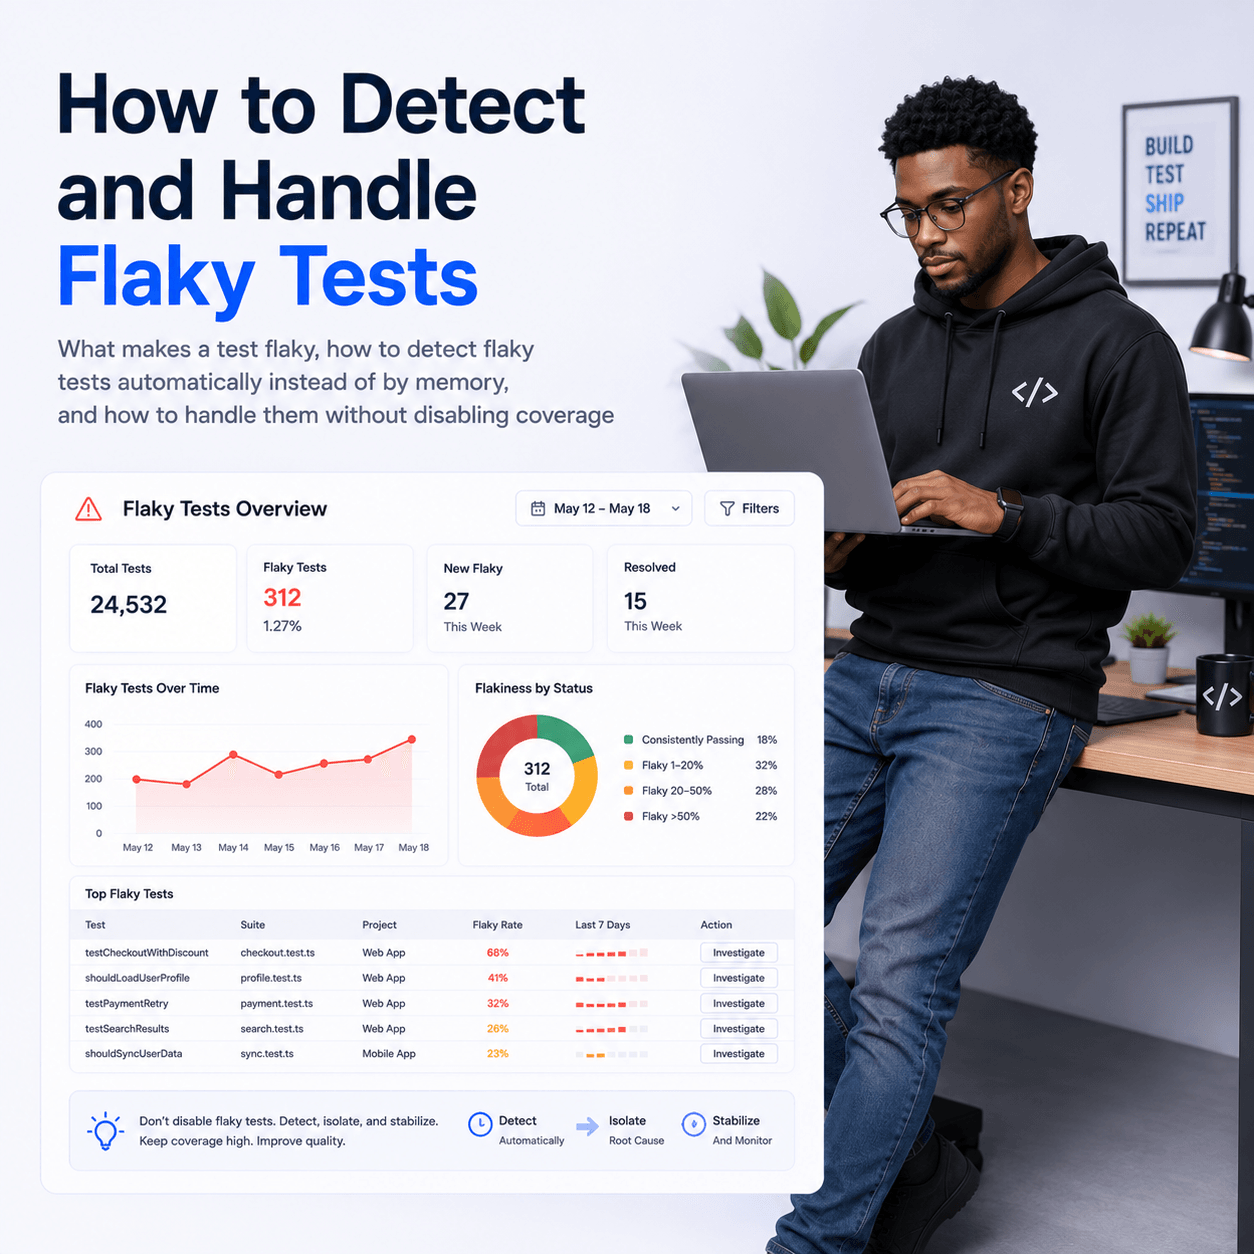
How to Detect and Handle Flaky Tests
What makes a test flaky, how to detect flaky tests automatically instead of by memory, and how to handle them without disabling coverage
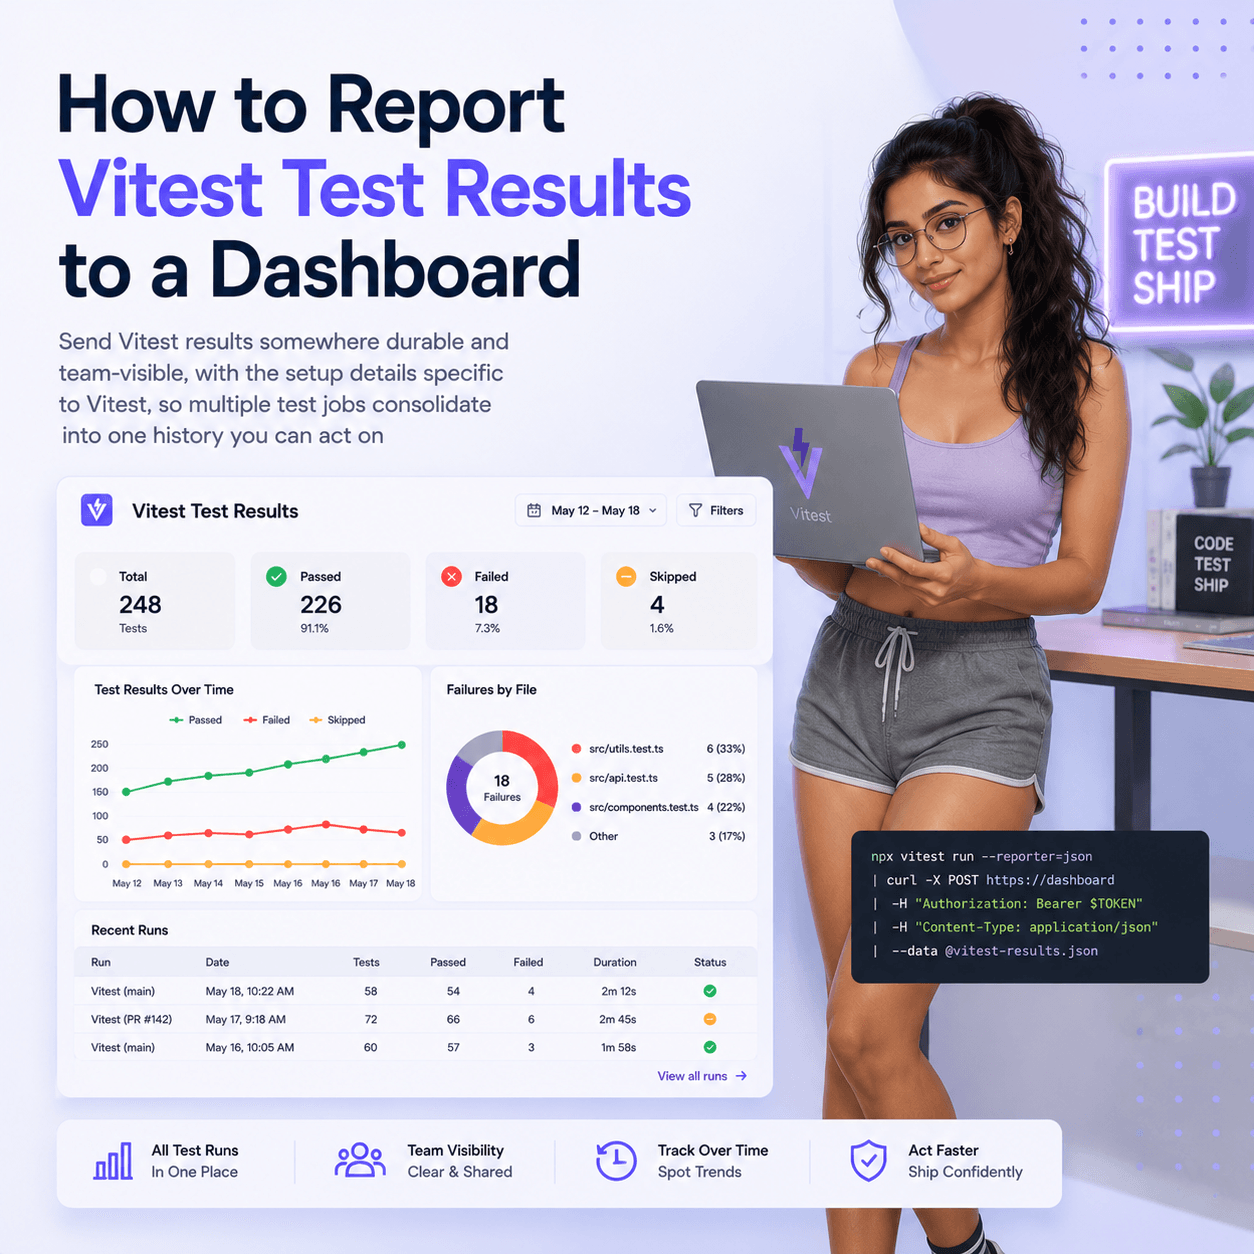
How to Report Vitest Test Results to a Dashboard
Send Vitest results somewhere durable and team-visible, with the setup details specific to Vitest, so multiple test jobs consolidate into one history you can act on
How to Report Go Test Results to a Dashboard
Go has no reporter plugin, so reporting go test results means parsing go test -json and uploading the cases yourself. Here is the whole pattern.
How to Report Jest Test Results to a Dashboard
How to send Jest results somewhere they are kept, viewable by the team, and comparable across runs, without giving up the default reporter
How to View Playwright Test Results in CI
How to get Playwright results out of the CI console and into a durable dashboard, including parallel shards, screenshots, and retained history
What Is a Test Results Dashboard and When Do You Need One
What a test results dashboard actually does, how it differs from your CI logs and your test framework report, and the point at which a team starts needing one
Diagnosing CI Failures Automatically With an AI Failure Diagnosis API
How to turn a red build into a root cause, a regression list, and a deploy gate without a human reading the logs