Automated Charting
Upload performance data as a CSV file with any test case for automated charting
Apr 13, 2018

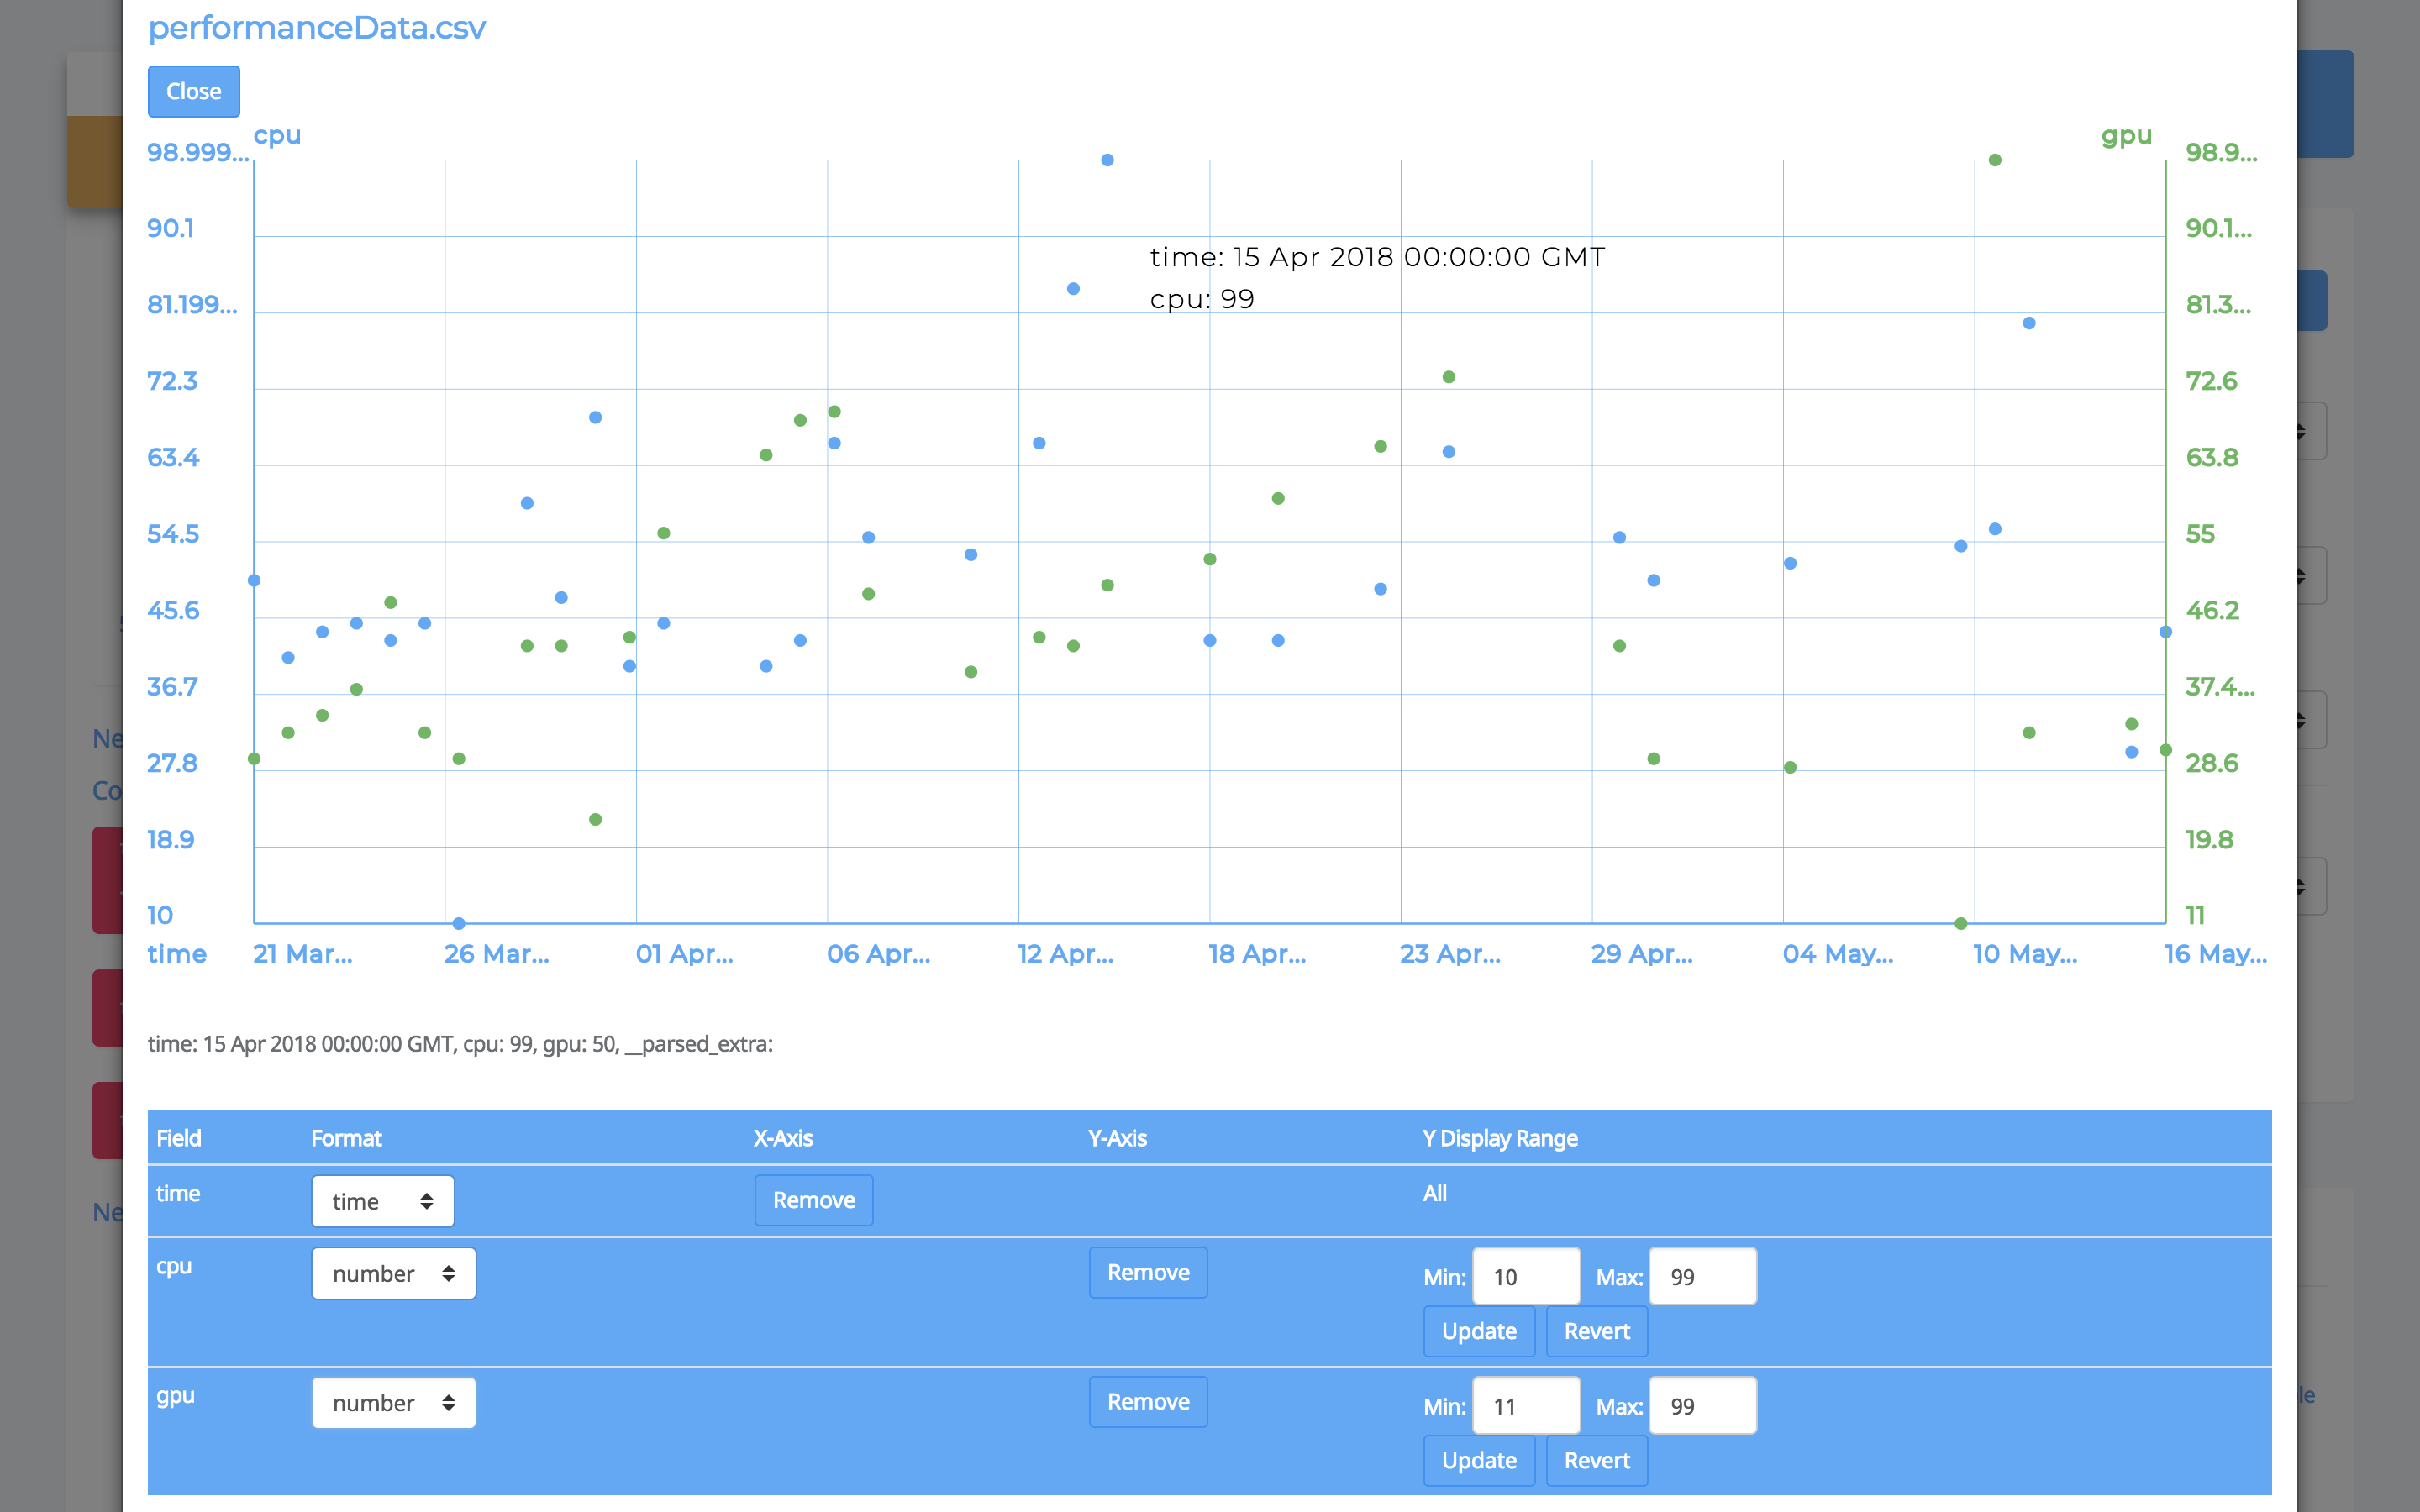
Upload performance metrics or any other data in csv format with your test cases to have Tesults automatically visualize the data as a scatter chart within the test case view.
You can chart one field across the x-axis and up to two along the y-axis. Tesults will automatically parse data and guess whether the field is a date/time, number or string. You can change formatting from easy to use dropdown lists.
As always your feedback is welcomed. Contact us and tell us what you think. Further enhancements around charting are coming.
- Tesults Team